The market has been volatile since the beginning of the month. This can add difficulty to making trading decisions. But it is also what we live for.
Today’s action in the S&Ps (ES) gave us three choice trades that set up with classic Wyckoff criteria and the use of David Weis’s Wave Chart. Let’s take a look:

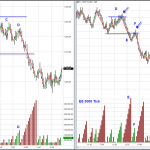
Two charts are presented in the graphic: a 9,000 Tick chart and a 3,000 Tick chart. You can see from the 9,000 Tick chart that after yesterday’s rally, the market went into a trading range overnight and through the morning session today. It had a small spring in the early morning hours at A and an Up Thrust at B – typical action in a trading range.
Of course, we always want to know how the market will leave the trading range – up or down. The structure and Weis Wave gave us exceptionally good clues. At C on the 9K Tick, we see the market unable to rally up to the recent resistance level at B. This is weakness. But the real clue came at C. We see from the Weis Wave that the market tried to rally but got nowhere. The volume on that wave, however, was the largest volume seen on any up wave in the trading range, and yet price had such a poor response. This is the classic Wyckoff principle of effort vs. result. As the market painted a hidden upthrust on the 3,000 Tick chart, a short trade set up gave its execution trigger.
Note the increased downwave volume on wave E (3K Tick chart). Supply has clearly hit the market. We look for a weak rally to short and this comes along with another hidden UT at F. The market falls and market structure is now clearly trending down.
A weak, corrective rally at G provides another short opportunity which carries the market lower. Later, skilled traders would note the shortening of the thrust as a sign to cover shorts as the market makes its lows for the day.
In the Wyckoff Method, we constantly assess the supply and demand characteristics of the market. It works on any time frame. If things like springs, shortening of the thrust, UTs and hidden UTs are foreign, or you are unable to read the market structure in order to be confident in making trades, then you might want to check out Chart Reading Mastery. This is an 8-week course (yes, we meet for 2 hours each week over two months) designed to teach you how to read a market like today’s. It starts next week. You can learn more here:
For David Weis’s excellent Wave Chart Plug-in tutorial and indicator package that truely gives unique insight into the supply and demand aspects of the market, you are invited to check it out here:
Weis Wave Tutorial Webinar & Plug-In

Very good post!
Gary, in my mind at G we see demand, because it is the largest up volume since the decline from the D. So, i would wait for pullback to go long, and not thinking about short. But you say, that point G is a weak, corrective rally. And you short it. My judgement is wrong (market went down), but i’m not understand what is the mistake in my analysis?
And second question, how you avoid to trading in this trading range from left to right? Trading inside of the TR hurts me often. It this TR we see plenty of trades which doesn’t produce. How you know when to stop trade it and ignore all of this false indications to go long/short?
Thank you so much, Gary!!!
Good questions, Dmitry. Wave G is a corrective rally for several reasons. First, locate the same wave on the 9,000 Tick chart. It is the first up wave after the long down wave. This should not look like demand is coming in to you now, right? There is nothing special about this wave volume on the 9K tick. The move up to G is also a simple 3-wave move (an a-b-c corrective wave in Elliott terms). The 3-wave a-b-c on the lower time frame coupled with a simple up wave on the higher time frame is a nice setup I look for when a market is trending. Here, on the 3K tick chart it is trending. Each downwave on the 3K shows strong downside wave volume. Supply is in control. Thus the conditions are right to short a corrective 3-wave pullback. So, as always, market structure and. in this case, good time frame coordination help us find trades.
Regarding trading in a trading range – I agree, it is usually more risky. Here, the odds favored the downside because of 1) the inability of the market to rally back up to resistance (at B on the 9K, indicating weakness – structure), and 2) wave D showed the principle of Effort vs. Result (a good amount of up volume could not push price higher, meaning someone was selling into the buying on that up wave). Also, just before wave D, there was a down wave with increased down volume. You can see this on the 3K Tick chart. The 3K Tick then painted a Hidden UT. So, there were several reasons for at least recognizing that the market was likely to turn down out of the trading range.
Even if you refrained from trading in the range, the trade at F was, as David Weis commented, “a gift” as the supply increased just before the weak pullback.
Thanks so much, Gary, now it is very clear for me!