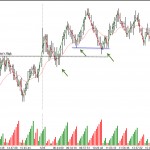
A trader from Australia wrote to me saying he had a very good start to his week using the 3,000 tick chart and market structure to place his trades in the S&P e-Minis. That’s a nice combination. I have been using tick charts since the early 2000’s. We’ve had to adjust them from time to time because of the increasing trading activity, but they are a very nice chart to work with. (We used to use 1,000 ticks!) One of the key advantages is that they compress the overnight data into a readable form. Trying to read the Asian and European sessions in the S&P e-minis off a 5-minute chart can be very confusing at times. The tick chart makes it clear.
 Today’s trades are a good example. Given Friday’s strong move, we would expect follow through today. A well-structured trade came in around 7:00 AM New York Time when price had pulled back to yesterday’s high on low Weis Wave volume. After making a new high, another pullback just after the US open offered another long trade. Later in the morning session, a Spring on top of yesterday’s high that was also tested gave what was probably for many the easiest trade. Failure to make another new high after the Spring told us the up trend was over for now.
The Aussie trader said he looks for only a few high odds trades in a given day. That’s a great attitude. You don’t need to trade every squiggle and squirm. Even small trades like today’s add up nicely into a very good day. Just keep taking the trades that set up well and keep a close eye on structure.

Leave a Reply