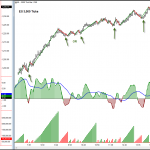
We were looking for a rally today, and we sure got a nice one!
Let’s take a look at how you can trade such a day:
Three Simple Tools can be a ‘Killer’ Combination
In the S&P e-minis and other active intraday markets, the combination of tick charts, the Weis Wave and the 3-10 Oscillator can be a ‘killer’ combination.
In last night’s post, I stated that I was looking for a rally today. (See last night’s post here for why my view was bullish.) The rally actually started just after yesterday’s US close and continued unabated throughout the US session.
Having a Game Plan
Having a good sense of how the market may trade the next day is a vital part of the game plan. We read that by the market structure, price bars and volume. When your analysis is confirmed by the market the next day, you then need to find a way to enter. I like the combination of tick charts, Weis Wave and the 3-10 Oscillator for intraday trading.
The 9,000 and 3,000 tick charts are what I use most during the intraday, though other tick formats can also be helpful. The tick charts make for smooth oscillator readings and aggregate the waves and wave volume very well.
Trade Setups Today

We had five trades in the direction of the trend day up today, starting around 7:30 AM Eastern Time on the 3,000 tick chart. This setup captured the building momentum from the overnight market seen in the 9,000 tick chart. Every trade setup after this was a basic oscillator and/or Weis Wave trade. Not once during the day did the Weis Wave signal supply, so staying with the long side throughout the day was the way to play this market today.
The basic tactic is to identify the direction for the next day, then use the basic tools of the 3-10 Oscillator and Weis Wave to help time entries. We have in-depth tutorials on how to properly use the 3-10 Oscillator and everything you need to know about the Weis Wave from its creator, David Weis. You can learn more at these links:

Leave a Reply