One of the key skills in trading the markets by its own action is the skill of understanding structure. Someone recently told me that they look solely at price and volume; they consider structure irrelevant. I can’t understand that attitude. To my way of trading, using structure is essential.
A good example of how structure plays a significant role in trading occurred on Thursday, just prior to the big run up ignited by the record low European Central Bank rate cut.
The ECB Trade
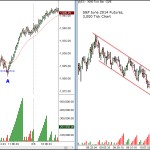
 When looking at structure, it helps to coordinate more than one time frame. In the charts, we are using the 9,000 and 3,000 tick charts. Tick charts have certain advantages over time-based charts (like, for example, a 5-minute chart), most notably the advantage of compressing overnight data into an easily readable format.
By coordinating the two time frames, we can see that the market was in an up trend and at A, the market returned to the supportive level of the 2-Day high. Volume on the 9,000 tick chart showed a drying up of supply at this structural market point. Since the 3,000 tick chart was oversold at this level, a trade could be confidently initiated to the long side as the market began to turn up. Traders who leaned against structure and the indications of supply and demand at a key point made a perfect entry on what turned out to be an almost 20-point run up.
20% off Video Tutorials
All video tutorials are 20% off. Use the coupon code: May20 at checkout. This sale ends on Sunday at midnight, eastern time.

Leave a Reply