group-29
  • 40% Spring Sale
  • Membership Plan
  • Courses
  • Training
  • Coaching
  • Dr. Gary
  • Blog
  • Book
  • Press
  • Login
  • 0 items
  • 40% Spring Sale
  • Membership Plan
  • Courses
  • Training
  • Coaching
  • Dr. Gary
  • Blog
  • Book
  • Press
  • Login
  • 0 items
  • 40% Spring Sale
  • Membership Plan
  • Courses
  • Training
  • Coaching
  • Dr. Gary
  • Blog
  • Book
  • Press
  • My account
  • Login
  • 0 items
×
  • 40% Spring Sale
  • Membership Plan
  • Courses
  • Training
  • Coaching
  • Dr. Gary
  • Blog
  • Book
  • Press
  • My account
  • Login
  • 0 items
You are here: Home / Trading Psychology / Follow-Up in the S&Ps

Follow-Up in the S&Ps

July 9, 2014 by DrGary 1 Comment

Yesterday, resistance was identified in the area of 1965 – 1970.  Today, the market stopped it’s upward movement at 1968.25.

2014-07-09 Daily ES
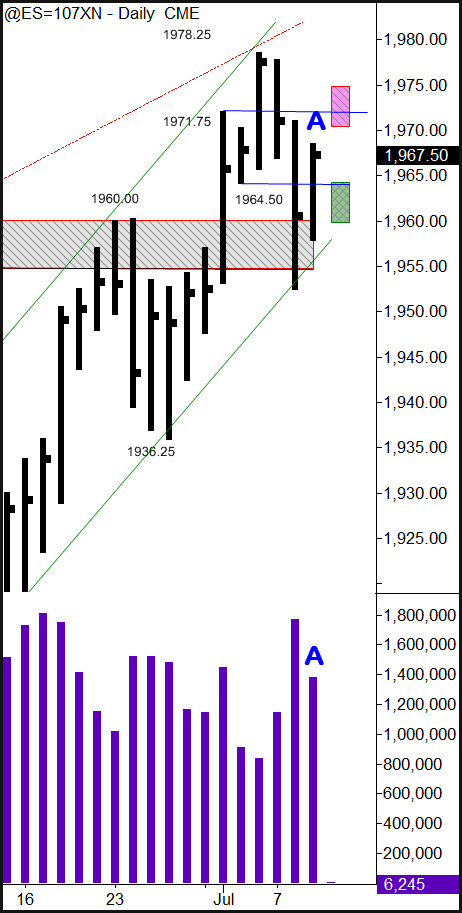
Today–marked A on the chart–was an up day.  Although it was up, it also traded inside the range of the previous day.  We had good volume, but the market remained largely range-bound.  We could be seeing the market accumulating around support as we have seen on several previous swift dips down.  That is entirely possible.  We could also be seeing the start of a larger pullback. Frankly, it is difficult to tell.  There certainly has been some weakness, but we are also sitting on top of support, holding that support, and in an overall strong uptrend.

The key level to me is the 1970-1975 area.  I’ve highlighted this area with a small red rectangle.  For tomorrow, I would expect continued follow through to the upside from today’s action.  Nonetheless, the area around 1970-75 is likely to be difficult for the market to overcome.  Watch this area carefully, especially if price reaches this level early tomorrow morning (US session) assuming the market goes up there.  Pushing through this area will indicate the buyers remain in control. Failure at this point will indicate sellers want to try for another push down.

Should the market pull back overnight (Asian & European sessions) or during the US session, pay attention to the 1965 to 1960 area.  We can see intraday support develop in here.  Pushing below this level indicates selling has resumed.  Holding this area (again, if it comes down to here) suggests buyers are acting on their convictions and higher prices are likely.


Tweet
Share
Pin
Share
0 Shares

Filed Under: Trading Psychology Tagged With: bar by bar market analysis, day trading, market analysis, stock market analysis, Stock Market Trading, Wyckoff method, wyckoff trading

custom message for non-logged in members here

Leave a Reply Cancel reply

Your email address will not be published. Required fields are marked *

Privacy, Disclaimer & Policies

Peak Psychology Inc and its website, TradingPsychologyEdge.com is an educational company. It has been providing customers from around the world training classes and products on trader mental skills, trader performance, and technical chart reading.

Trading Stocks, Futures, Options on Futures, and retail off-exchange foreign currency transactions involves substantial risk of loss and is not suitable for all traders and investors. Past Performance is not indicative of future results.

The testimonials are from selected customers. Their experiences may not be typical of what you can expect to achieve, As results may vary. Claims contained within testimonials have not been verified. Customers were not paid or compensated in any way for their statements.

dmca

Recent Posts

  • Dr. Gary’s Market Insight June 17-21 2024
  • TradeMindfully.com Offers Classes on David Weis’s Trades About to Happen
  • Join Dr. Gary’s Free Webinar on How to Develop Yourself as a Mastery Trader
  • Let TradeMindfully Be Your Support System
  • Dr. Gary’s New Website Is Live

Search

  • Facebook
  • Instagram
  • Pinterest
  • Twitter
  • YouTube
Back to the top
group-29

Sign up to get the Recorded Free Webinar, New Course Releases and more…

  • About
    • Dr. Gary
    • Book
    • Press
  • Courses
    • Chart Reading
    • Trade Setup & Indicators
    • Trading Psychology
    • Specialty
    • Trading Procedure & Technique
  • Offerings
    • Coaching
    • Membership
    • Training
  • Help
    • Dr.Gary’s Blog
    • FAQ
    • Free Content Library
    • Contact Us
𝕏

Coppyright © 2023 Peak Psychology Inc. All Right Reserved | Term of Service | Privacy-Policy

Any and all information contained on this website is provided for educational purposes only and should not in any way to be construed as investment advice.

×