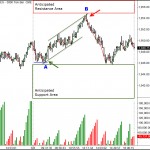
I n yesterday’s post, I noted that there was less volume and less range on Friday, indicating that buyers were becoming tired and to be aware of a potential intraday reversal. Support was identified in the 1940-45 area and resistance could see the market lose steam around 1955-60.
Lows were made first today when the market pulled back on low volume into 1946. Minutes before the US Open, the market had a spring (A) at anticipated support that propelled a nice rally to the day’s high of 1954.75 (B). It was at that point where intraday resistance coincided with higher time frame resistance causing the market to reverse and retrace all it’s gains for the day. Not bad for a Monday.
I was asked whether Fibonacci projections were used to estimate support and resistance. There are no Fib, pivot point or other calculations used in my analysis. Support and resistance are based on market structure, nothing else. Market structure is taught in Chart Reading Mastery.
Summer Sale of Video Tutorials
Helen has extended the 20% discount on all our video tutorials. We will put up a separate post about this later in the week, but you can get a head start by using the code May20 at checkout for the 20% discount on any of the video tutorials, including Chart Reading Mastery.

Leave a Reply