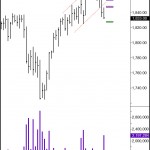
The US Stock market as measured by the S&P 500 e-Mini futures fell after weakness appeared at the recent highs. You can learn about the recent weakness and how it was detected from the last two blog posts discussing comparative weakness in the main US markets and the clear evidence of selling in recent days, among other signs of weakness.
 We are now probably a bit oversold short term. (Click on the thumbnail image to the left to bring up the chart discussed here.) Any lower prices early next week will likely be contained around the 1830 to 1825 level (green rectangle). Any rally up will likely be halted around the 1845-1850 level (first middle red rectangle). An unlikely rally above that on Monday will find stiff resistance around the 1855-1860 level (upper red rectangle).

Leave a Reply