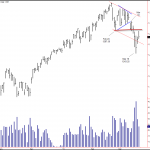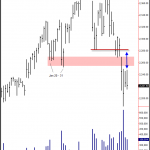
On Friday, the S&P futures (ES) gapped open up above the highs of the previous three days but couldn’t hold. More importantly, it couldn’t break above the February 24th low of 1287.50.
On March 10, the S&Ps broke out of an apex to the downside and continued lower until March 16th to a low of 1243.25. We had the largest volume day on the 16th since the days around the May 2010 flash-crash. The high volume stopped the decent. We see buying come in at an oversold position.
The rally since has been on receding volume. Buyers have been reluctant to follow the market higher. Friday closed poorly with a hidden up thrust.
To put things in perspective, so far we have had a drop of 94.75 points off the mid-February high. This is almost twice the length of the last downdraft we had in November 2010 (53.75 points). But it is still considerably less than the “flash-crash” fall, which cost the market 206.75 points between the April 2010 high and the July 2010 low.
Inharmonious Action

The Nasdaq continues to be the relative weak market. You can see that the late January lows have been resistance to the Naz. Friday’s gap up and rally in the S&Ps and Dow was not matched by the Naz. Wyckoff called this type of non-confirmation “inharmonious action” between the indices. Until the Naz develops strength, it is going to be hard for the S&Ps to sustain an up move.
Volatility Can Increase
On Friday, the Russell 2000 painted the narrowest range in the past few weeks of trading (not shown). The Naz futures have been trading within Wednesday’s range the past two days. These conditions can set up increased volatility for Monday.
Levels for the S&Ps
Levels to watch in the S&Ps for Monday include the 1282 – 1285 area. A failure to penetrate and hold above this level could trigger a move down toward a test of the March 16th lows. A rally above the 1287 level would indicate that the market wants to test higher. It could then make a run towards the 1300 level. I am also seeing the 1272 – 1275 level as an important support. If this level is broken, it could start us off toward lower prices down to the 1260 – 1255 area or perhaps lower.
Keep in mind that the crisis in Japan isn’t over and Libya is now a concern for the market. Any bad news is likely to cause a swift reaction.
Chart Reading Mastery
We will be starting the next Chart Reading Mastery course on March 30. This runs for 8 weekly sessions. Sessions are at least 90 minutes each and are recorded. If you are interested, you can still save $400 by using the coupon Mastery400. Last week, we held a free, “preview webinar” where I discussed several charts along with choice trade locations and setups. We also discussed what to expect in the course and highlighted the rich level of content. You can access the free video here: Chart Reading Mastery Free Video.

Leave a Reply