New Stock Market Highs: Are They Real?
Last week, the S&P 500 Index made new stock market highs, closing at 3037.56. Are they real? The yearly chart shows that after springing the lows made in 2002, the S&P cash index has been up eleven years in a row, except for last year when the market closed down. Note the volume increased to the downside in 2018, indicating some selling hit the market. I also notice some shortening of the upward thrusts of the price bars: upward progress made in 2018 was less than 2017, and lesser, still, so far in 2019.
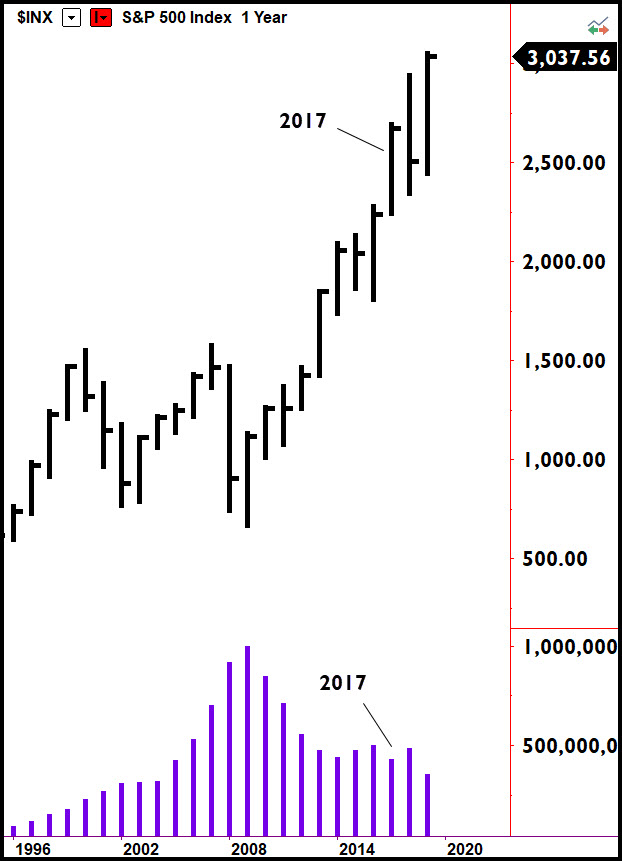
Although we still have another three months left in 2019, note that so far, volume is comparatively light. It’s not, for example, greater than the downside volume of 2018. Thus far, 2019’s volume is more like 2017’s volume.
New Market Highs Are They Real? Quarterly Chart
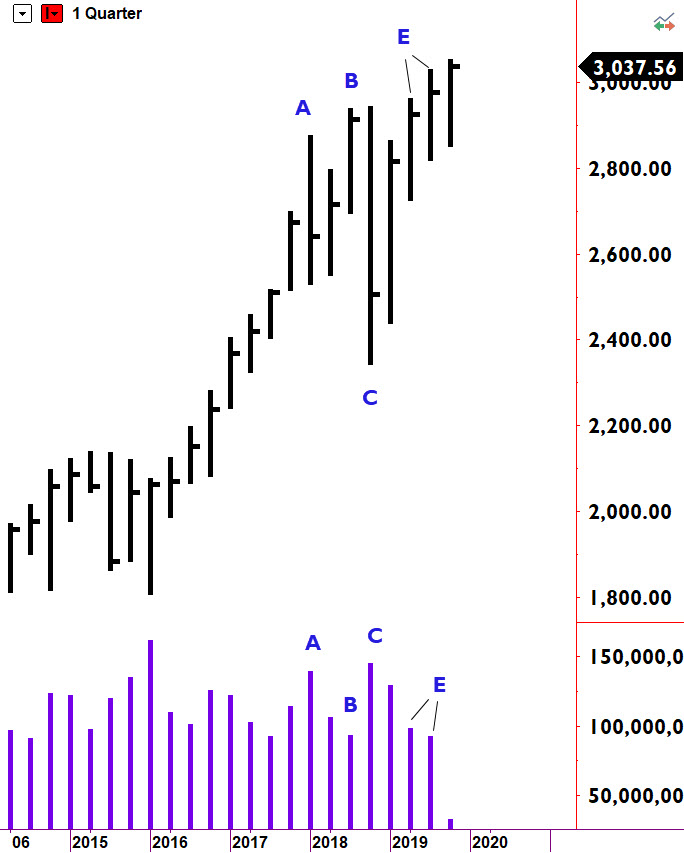
Let’s step down a time frame and look at the quarterly chart for the S&P cash index. We see the market rallied up into the first quarter of 2018 when some selling pushed the market down (bar A). Six months later (bar B), the market tries to regain the highs but does so on low volume. This “no demand” results in significant supply coming into the market during the last quarter of 2018 – an unusual time for a market sell-off. The market has rallied since, but I can’t help but notice it has done so on decreasing volume over the last six months (bars E). New stock market highs made on lowered volume are suspect.
New Stock Market Highs Are They Real? Details on Monthly Chart
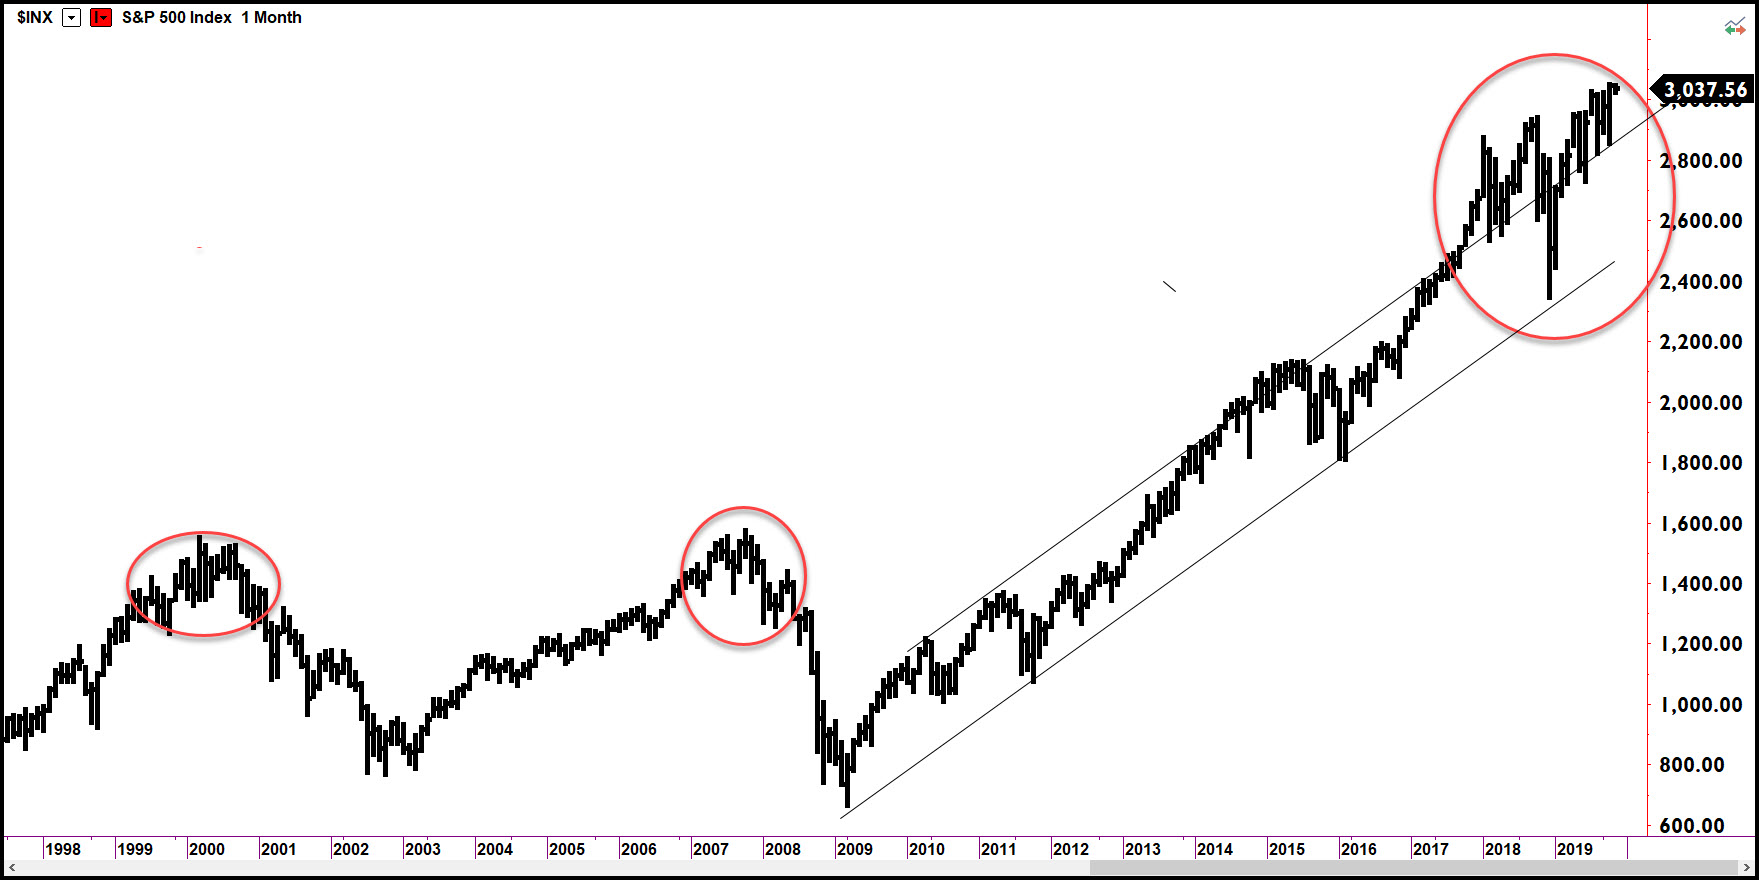
Two charts show the monthly data points for the S&Ps. The first is a 20-year view of monthly price bars with circles drawn around the highs of 2000, 2007 and the current highs. Note the size of the downside price action of the current market with the 2000 and 20007 highs. The current market swings down are deeper and stronger. This is more indicative of heavy selling and distribution rather than buying and accumulation.
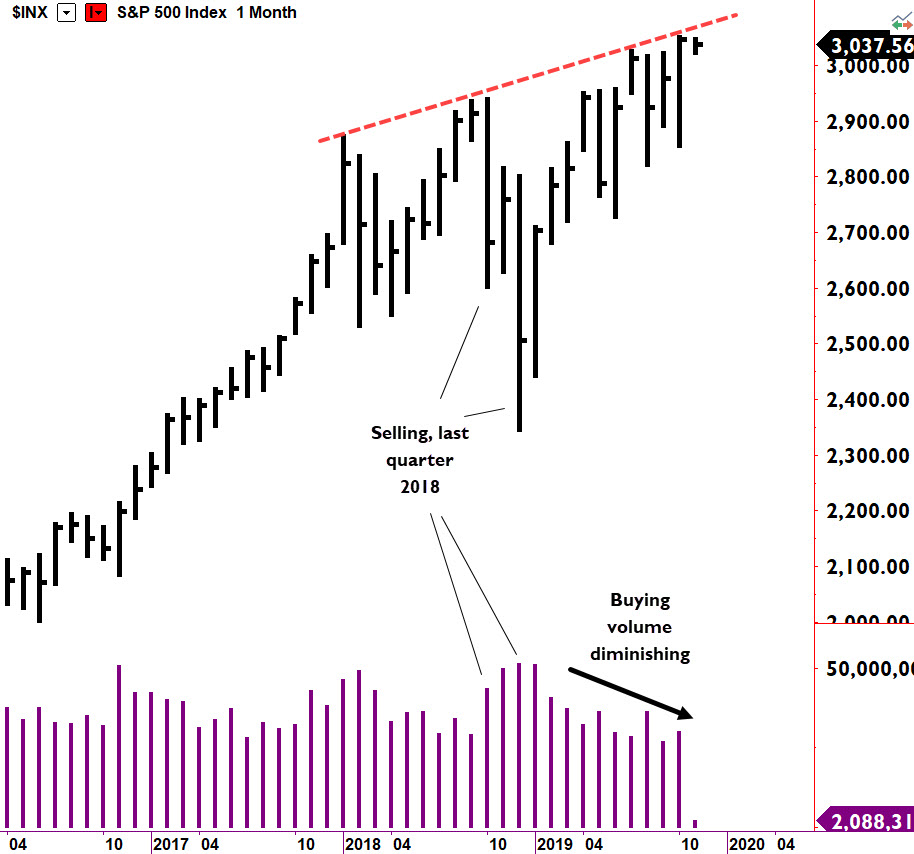
On the monthly chart, we are overbought in the long-term trend channel. The detailed chart of the current market shows the selling in late 2018 and the diminishing demand this year. A Reverse Use of Trend Line coupled with supply already seen and lack of new demand volume on the rally suggests additional upside progress may be limited, despite the recent Fed rate cuts (there have been three) and the recent infusion of liquidity through increased Fed repurchase operations (since early October). These external activities are likely to keep the market buoyant for a period of time, but eventually, the market will have it’s way.
Here is a link to the Federal Reserve’s recent repurchase operations: New York Fed Repurchase Operations

Thank you for your analysis, which platform do you use, do I like it?
This is MultiCharts. I also use TradeStation.
I agree that we are going up on lower volume, but it doesn’t mean that the market move is about to reverse. See the monthly volume from 2012 to 2014 – it was also lower but the market kept on going up. On top of that, the TSAA club in San Francisco predicts a Nasdaq move to 10k based on the point and figure analysis. I believe the TSAA analysis b/c Hank Pruden predicted the Dow at 20k in 20101 based on the P&F analysis of the 2008 bottom – and he was the only one.
Thanks for posting. The context today is different than 2012 -2014. The important differences include: 1) the heavy buying in 2011 after the flash crash; and 2) the lack of selling during that period. Contrast with the downdraft going into 2019. Selling followed by No Demand is a caution here. I didn’t say that the market is about to reverse but that the lack of new demand volume on the rally suggests additional upside progress is likely to be limited, despite the recent Fed actions (rate cuts and repos). I concluded by saying, “These external activities are likely to keep the market buoyant for a period of time, but eventually, the market will have it’s way.”
Be cautious about predictions off P&F charts. Bob Evans always counseled they should be used in the same way you approach a train tracks: you “Stop, Look & Listen” (his words; not mine). What he meant is that P&F charting is helpful, but you don’t just make a P&F prediction and ignore everything else. He was adamant about this and, if I recall correctly, dedicated one of his weekly tape recordings where he demonstrated numerous P&F projections that never happened.
Hank was a fine man, a great teacher, and an outstanding Wyckoff proponent. He understood the nuances of Wyckoff and knew how to teach it. He was also a lot of fun to be with. I miss him.