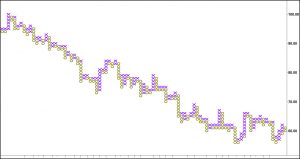
Many traders may think that a point & figure chart is only useful to estimate targets of future price moves. While projecting likely targets is a valuable feature of P&F charting, it’s not all that they tell the savvy trader – not by a long shot!
Here is the challenge for you:

The chart shows a popular US stock. Based on this P&F chart, this stock is:
- About to fall another 5 points and then goes into a protracted trading range
- About to have a rally which runs over 80 points
- About to have a breath-taking, 50-point drop?
- Starting a protracted, sideways trading range that lasts months
The correct answer is #2. This stock has run up over 80 points form the 55 low. All the way up, it has shown excellent P&F principles. Trades applying P&F charting to theri trading of this stock had a great edge when it comes to understanding:
- support and resistance
- signs of strength and signs of strength and weakness
- marking-up and marking-down
- accumulation and distribution
- how far the anticipated move was likely to go
- and more.
We will go into detailed analysis as to why #2 is the correct answer in our P&F course, which has now become two Tuesday classes, November 10 and 17 due to the large amount of material we will be conveying. There is so much good stuff to know and apply with P&F analysis, we decided to do this over two sessions–we just didn’t feel we could fit it all into one. You will learn how to use P&F charting to better understand what the market is likely to do next and maximize your profits. For details, click this link:
Point & Figure Charting to Maximize Your Profits
From now to November 10, 2015, you can save 50% – so register NOW! The price will go up after Nov. 10, 2015
Because of its popularity, odds are you may have traded this stock or are trading it now. Wouldn’t you want to know its likely next move? Wouldn’t possessing that ability be valuable and profitable for you and your trading?
This market is giving specific ‘tells’ about what it is about to do next. It’s just like the ‘tells’ professional poker players easily see in the other players sitting around the poker table. These ‘tells’ give the pro special insight about their next best play. P&F chart also sends out market ‘tells’ readable by any trader with the knowledge to do so.
Once you know what to look for, you will see these ‘tells’ over and over in the markets you trade. So jot down your answer and come to our webinar on Nov 10. We will discuss all the ‘tells’ this chart is providing in detail and in depth in our Point & Figure Charting webinar on Tuesday, November 10th. Our aim is to provide you with detailed knowledge about point & figure charts so that you can take this knowledge and turn it into solid ability and skill for your trading. In other words, our aim is to help you develop your knowledge, skills and abilities as a trader for greater trading success!
Confidence comes not by how much you win on any given trade but by knowing you have the correct information and the needed skills and abilities to effectively interact with the markets at any given time. Deeply understanding point & figure charting will significantly add to your ability and skill in trading the markets. It’s an extra edge that improves you confidence when you are able to understand how to tell the market’s likely next move.

Leave a Reply