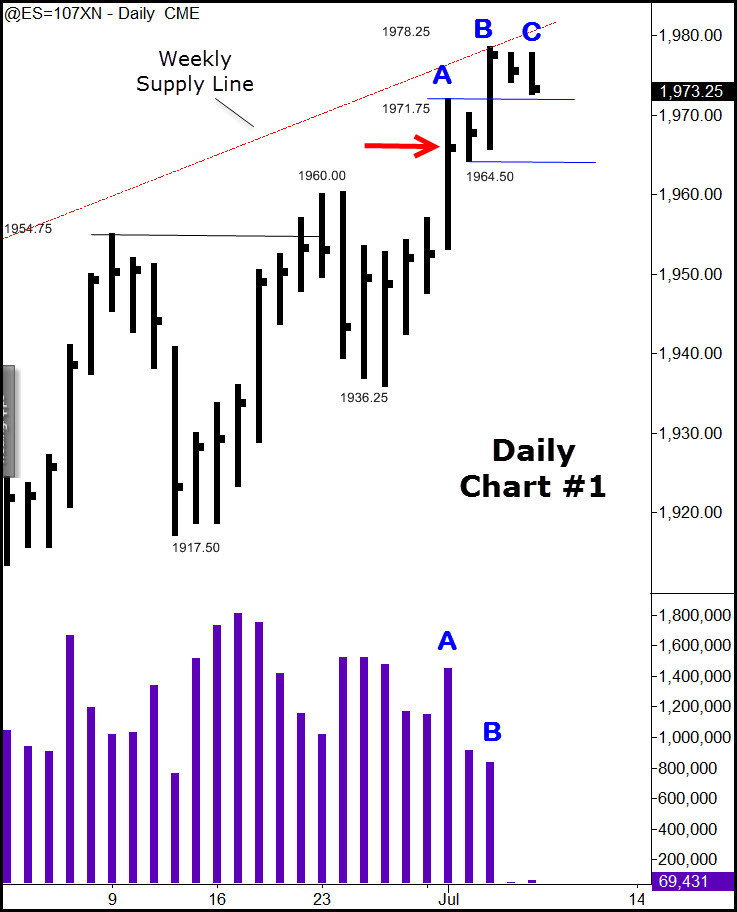
 I showed Daily Chart 1 of the S&P e-mini futures in a free webinar held by TradeGuider yesterday (Monday) morning. You can see that Monday’s bar C was still in progress. We noted that we were likely creating a top and could expect at least a modest pullback. Here was the rationale:
The daily chart had reached the Weekly Supply Line (red trend line) on Thursday last week (B). We noted that the volume had lessened considerably at B indicating lack of buying on the highs and that this was the last day preceding the Fourth of July holiday, which is typically a bullish week. Earlier on Tuesday at A, the market broke above the 1960 resistance level on good volume, but the close and the sustained volume gave the telltale sign of selling into the rally. This added to the story of a potential pullback. At the time of the webinar, we discussed a move down towards 1964, if the market could push below 1971.75.
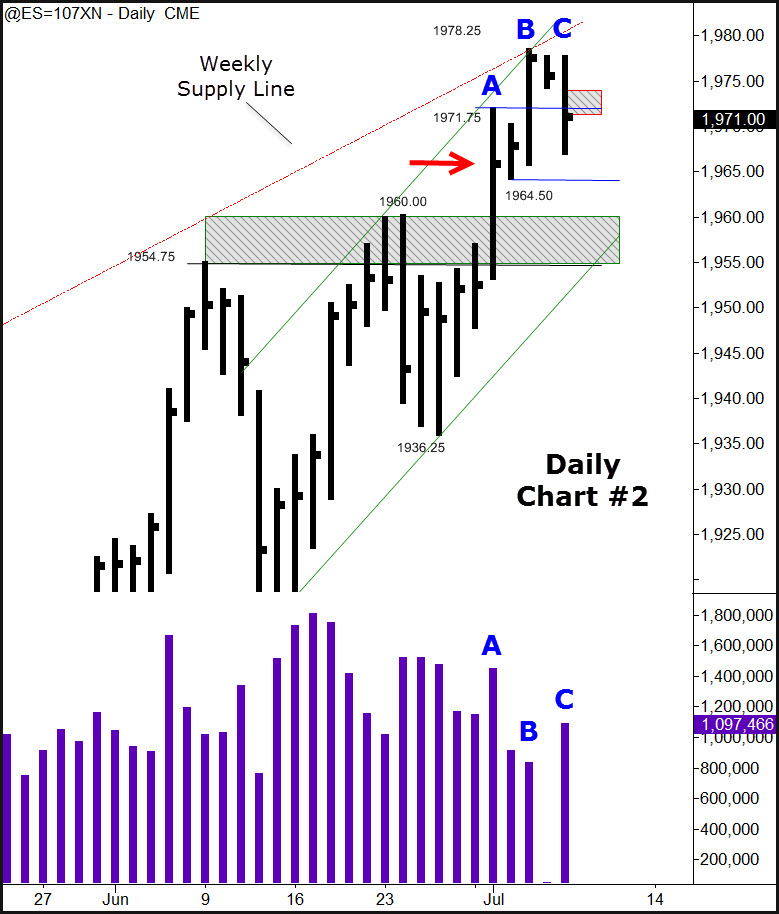 Later that night in a make-up session for the weekly Deep Practice group, we discussed the S&Ps and the next likely move in Daily Chart 2. I added a little more detail.
We noted that supply clearly came into the market as seen by the poor close and increased downside volume at C. We discussed how the next day or two would likely see a run down into the 1960 to 1954 area. This is highlighted by the large rectangle. Because of the close under the top of A on Monday, the odds of much of a rally the next day (today) were low, and the small rectangle highlighted the area where we would look for any rally up to die out. The short term daily trend channel was also added, giving us an initial target for the reaction.
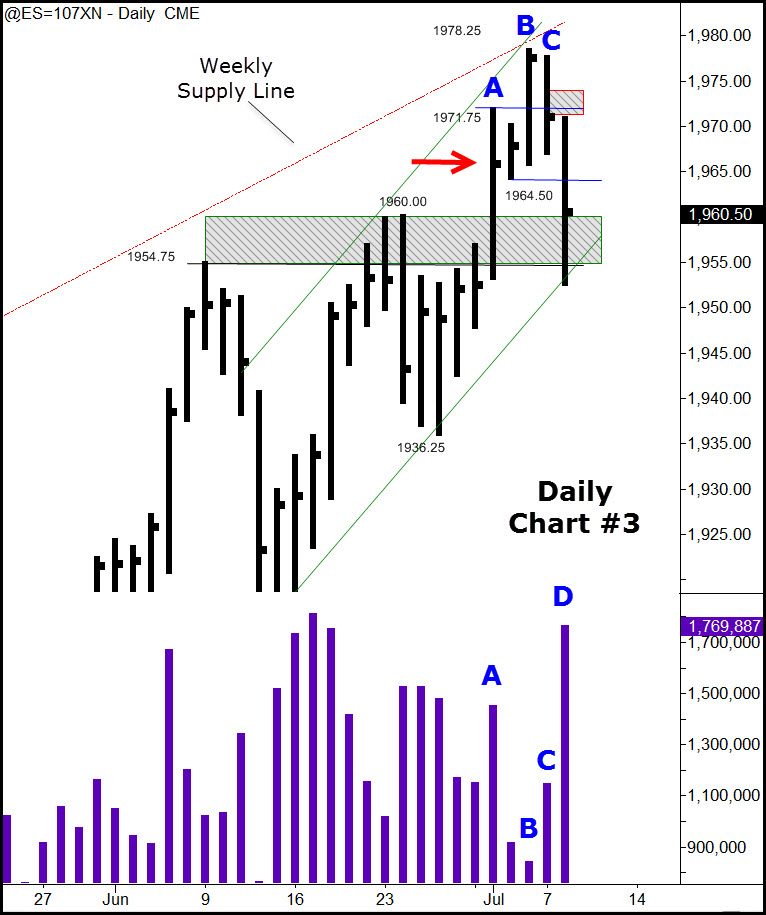 You can see the result in today’s (D) price action.
Although today stopped at the anticipated support level, some damage has been done to this market. Any rally up tomorrow is likely to have difficulty between 1965 and 1970. If the market shows some unexpected resilience and is able to get above that level, stiff resistance will be met around 1975. Because we have had two days down in a row and today had heavy selling, support is likely to come in a little lower, around the 1950 level. Should the market want to sell off again tomorrow, and push through 1950 decisively, it could easily slide down to the 1940-35 area.
Understanding tops like this (and bottoms, too) is the subject of a new webinar we will be holding on July 22nd. Learn how to read tops & bottoms and dramatically improve your trading. You can learn more about the webinar—including the current discount offer—by clicking on the Trading Tops & Bottoms button at the upper left of the website or here:

Leave a Reply