group-29
  • 40% Spring Sale
  • Membership Plan
  • Courses
  • Training
  • Coaching
  • Dr. Gary
  • Blog
  • Book
  • Press
  • Login
  • 0 items
  • 40% Spring Sale
  • Membership Plan
  • Courses
  • Training
  • Coaching
  • Dr. Gary
  • Blog
  • Book
  • Press
  • Login
  • 0 items
  • 40% Spring Sale
  • Membership Plan
  • Courses
  • Training
  • Coaching
  • Dr. Gary
  • Blog
  • Book
  • Press
  • My account
  • Login
  • 0 items
×
  • 40% Spring Sale
  • Membership Plan
  • Courses
  • Training
  • Coaching
  • Dr. Gary
  • Blog
  • Book
  • Press
  • My account
  • Login
  • 0 items
You are here: Home / Uncategorized / A Short Study of Volume

A Short Study of Volume

June 18, 2018 by DrGary 3 Comments

A Short Study of Volume

Here is a short study of volume in this morning’s S&P futures (ES, e-Mini).  We are using the Weis Wave, which aggregates wave volume, and the 3,000 Tick chart, which shows overnight waves well.

Study in volume

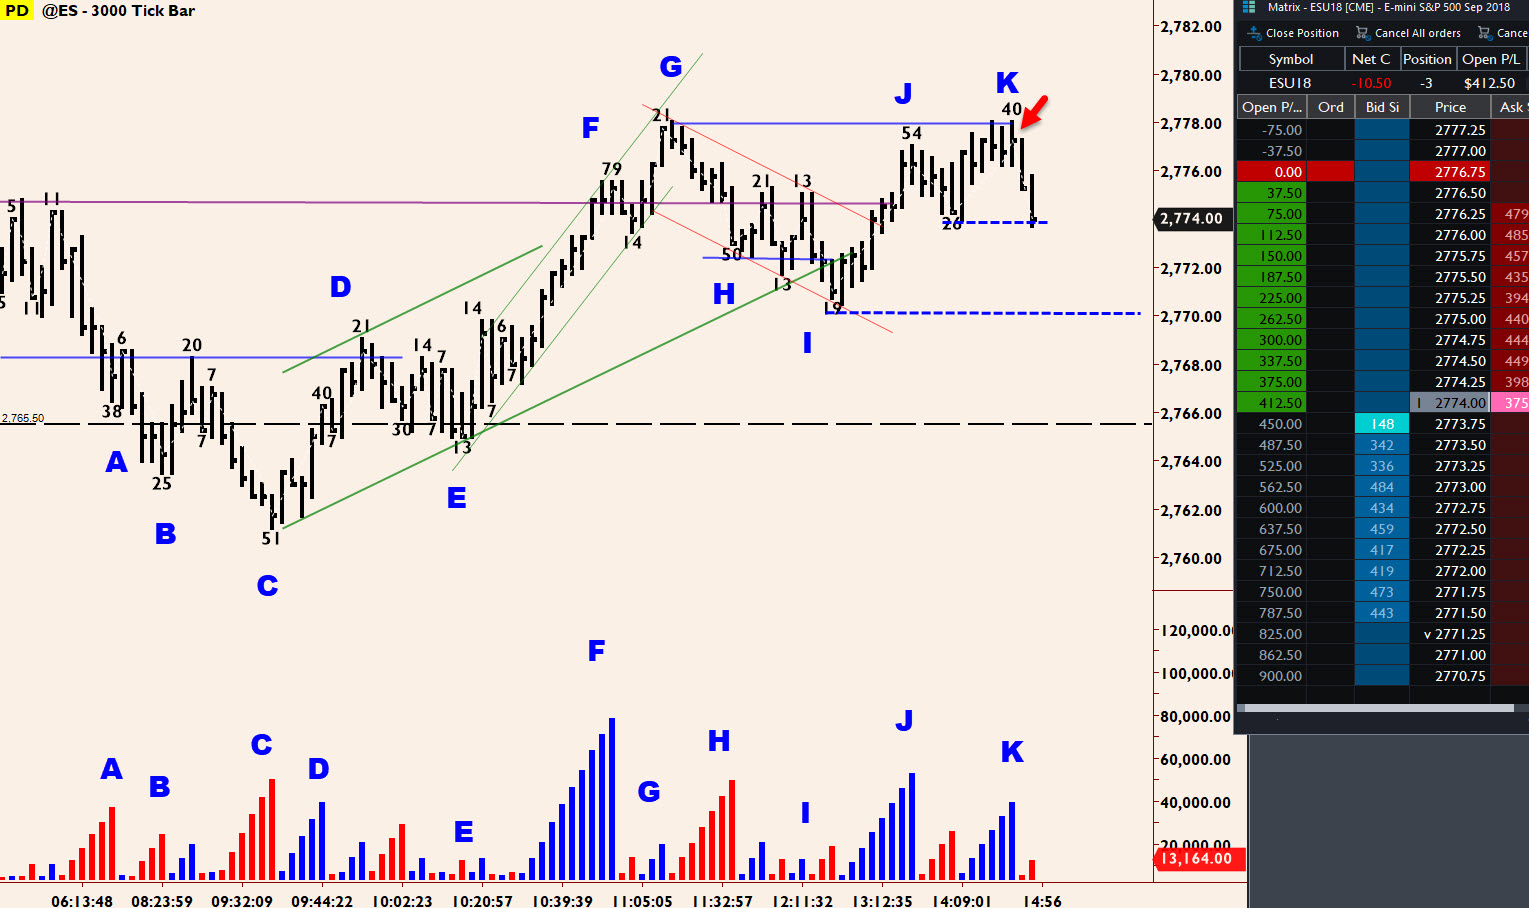
A: Supply into yesterday’s low, no question about it.

B: We break yesterday’s low and selling isn’t strong.  Hmmmm ….

C: A push down, but all that downside volume isn’t pulling the market down hard.  We call this Effort to go down, but no real result.  There is selling, but the buying is stronger.

D: Demand shows itself for the first time this morning.

E: No Supply.  What happened to all the sellers?  Anywhere in here is a buy spot.  Note there’s no rush to get into the market.  We let a story of supply & demand unfold until it is clear which side had the advantage.  Then we go with that side.  Here, it’s demand that has the upper hand.  We see this in our study of volume and price action.

F: Demand overcomes supply.  This is the anticipated result of the story of supply turning to demand.

G: The opposite side of the coin from E.  No Demand.  It’s overbought and an aggressive sell spot.  Because of the demand in the background, however, it would be a scalp-only trade.  In other words, given the market’s overall tone, we don’t anticipate a big move down.

H: Heavy downside volume since C.  Potential change of behavior?

I: Heavy downside volume dries up.  False alarm.  Any remaining shorts covered.

J: Demand reasserts itself.

K: A small pullback on comparatively lighter volume into a support level.  Normally, we would buy this but the overhead resistance at the 2778 level makes this less than a choice setup, and we pass.

L: Good upside volume, but no reward.  Market should have jumped the resistance at F/G but doesn’t.  Another short spot.

You can see the short from the resistance at L.  We’ve had a little profit coming down to the last swing low.  The play is for a break of this support and a run down to the 2769 low.  But, it could also spring.  A portion of the trade was covered at the swing low.  If the market does spring, we will simply cover the remainder.

Postscript: It did start to spring and we covered.

Tweet
Share
Pin
Share5
5 Shares

Filed Under: Uncategorized, Wyckoff Trading Tagged With: day trading, Weis Wave Trading, wyckoff trading

custom message for non-logged in members here

Comments

  1. David Hamburger says

    June 19, 2018 at 2:40 AM

    The chart only shows to point K? Where is point L?

    Reply
    • DrGary says

      June 19, 2018 at 11:25 AM

      Good catch – Thanks. I uploaded an outdated chart yesterday. I’ve uploaded the correct chart.

      Reply
  2. Ramiah Ramasubraman says

    June 20, 2018 at 1:08 AM

    Hi Gary,

    The newly uploaded chart is still missing point L.

    Reply

Leave a Reply Cancel reply

Your email address will not be published. Required fields are marked *

Privacy, Disclaimer & Policies

Peak Psychology Inc and its website, TradingPsychologyEdge.com is an educational company. It has been providing customers from around the world training classes and products on trader mental skills, trader performance, and technical chart reading.

Trading Stocks, Futures, Options on Futures, and retail off-exchange foreign currency transactions involves substantial risk of loss and is not suitable for all traders and investors. Past Performance is not indicative of future results.

The testimonials are from selected customers. Their experiences may not be typical of what you can expect to achieve, As results may vary. Claims contained within testimonials have not been verified. Customers were not paid or compensated in any way for their statements.

dmca

Recent Posts

  • Dr. Gary’s Market Insight June 17-21 2024
  • TradeMindfully.com Offers Classes on David Weis’s Trades About to Happen
  • Join Dr. Gary’s Free Webinar on How to Develop Yourself as a Mastery Trader
  • Let TradeMindfully Be Your Support System
  • Dr. Gary’s New Website Is Live

Search

  • Facebook
  • Instagram
  • Pinterest
  • Twitter
  • YouTube
Back to the top
group-29

Sign up to get the Recorded Free Webinar, New Course Releases and more…

  • About
    • Dr. Gary
    • Book
    • Press
  • Courses
    • Chart Reading
    • Trade Setup & Indicators
    • Trading Psychology
    • Specialty
    • Trading Procedure & Technique
  • Offerings
    • Coaching
    • Membership
    • Training
  • Help
    • Dr.Gary’s Blog
    • FAQ
    • Free Content Library
    • Contact Us
𝕏

Coppyright © 2023 Peak Psychology Inc. All Right Reserved | Term of Service | Privacy-Policy

Any and all information contained on this website is provided for educational purposes only and should not in any way to be construed as investment advice.

×