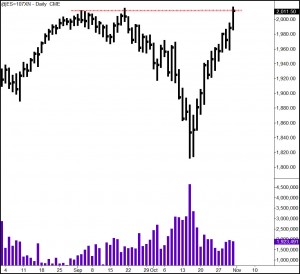
This stock market analysis like all of our analysis is based on the market’s own action. No indicators are used. We are simply using the law of supply and demand to determine the next likely move in the market. Here, we look at the S&P e-minis as a representation of the US Stock Market.
Stock Market Analysis
 We have obviously been on a strong rally and made new, all-time highs on Friday. The rally started as a V-Spike reversal, one of the strongest actions a market can take. There was little time spent at the lows. The market made a low of 1813 in mid-October, tested that low the next day, and took off from there. So far, we have seen no pauses in the rally. Both the Dow 30 and the Nasdaq 100 are trading in sympathy with the S&P 500. All three major US markets are showing good strength. From a market analysis perspective, the US Stock Market continues to be a strong market.
Stock Market Analysis for Next Week
Our stock market analysis for the coming week favors one of two bullish scenarios playing out. The first would see the market push decisively through the September highs painting new all-time highs early next week. After putting in those highs, we next see the market come back and test the 2015 area (red dashed line) before rallying higher. The second bullish scenario would see the market pull back off the recent highs, but only slightly, giving the market an opportunity to absorb any residual supply at the 2015 level. Dips into and below the 2015 level would reflect testing, spending little time at lower prices and quickly bouncing back up. Trading below last week’s low would alter the bullish outlook.

Leave a Reply