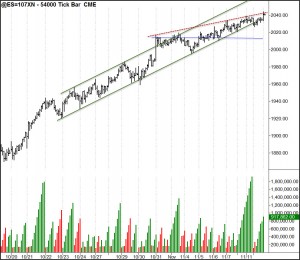
Last weekend, our stock market analysis indicated that the 2040 area would be difficult for the market to move through. That has been the case for the past several days. Although we are seeing potential diminishing demand, dips down have been met by buying. We haven’t seen much of a pullback.
Stock Market Analysis Key Question
The key question for the remainder of this week is will resistance have an effect on the market and cause it to falter?
 I’ve posted a longer-term tick chart for a more detailed stock market analysis. You can see the strong uptrend since late October. We can also see that the uptrend is also showing some weakness. The market is having difficulty stretching up to the top of the trend channel and the trend support level—the demand line—is beginning to weaken. We had a lot of volume come into the market on Monday and Tuesday. Although the market moved up on the volume, I can’t say that the volume pushed the market up easily.
Should this 2040 area (today’s overnight high thus far was 2043.75) hold as resistance, the market could move down into the 2030 area and find support. A break below 2025 (yesterday’s low) could draw out supply. Until we see supply come in, however, we have to favor the more bullish scenario. Should a little supply come in, we could see a pullback to the 2015-2010 area (blue line), perhaps sometime next week.
Free Webinar Next Week
Just a reminder that I will be holding a free webinar on Wyckoff principles next week. It will run about 30 minutes or so and we’ll look as the recent and current markets. You should come away with some usable knowledge you can immediately apply to your trading. Join us by registering:
David Weis Webinar
Several members of our community have been asking about the webinar we’ve scheduled with David Weis. We’ve postpone the webinar until early January at David’s request. We will keep you posted on the date when we get closer to January.

Leave a Reply