The coming week should be an interesting one. We have a fair amount of reports coming out (Housing, CPI, FOMC Minuets, Jobless Claims) that can cause increased volatility.
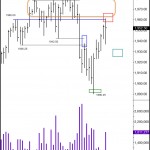
 Two weeks ago the US Stock Market (represented by the S&P e-minis) fell hard. There was follow through to the downside in the early part of the next week, and then the market hit support and began to turn around. Last week, the market continued the upside momentum and rallied into resistance at 1960. We highlighted this resistance in Thursday’s Deep Practice. You can see the red box I drew to signify an area where the market would likely hit selling.
Note the volume and the erratic behavior on Friday (last day on the chart). There was quite a bit of selling seen on Friday morning after four days of light volume on the rally (check your hourly chart, not shown).
After selling off, the market did rally on Friday afternoon, but like most summertime Friday afternoons, the volume was light.
Next Week
The key question for early next week is: Can the market push significantly up above the 1960 level? If it does, it has several weeks of sideways price action to overcome (highlighted in orange). While the market may shoot through this area, more typically, these areas act as resistance. Friday’s increased volume and swift morning downdraft suggests selling is active around the 1960 level.
For early next week, watch the area between 1960 and about 1965-67 if price can rally above Friday’s high (1961). Resistance could enter in this area. Selling could also come in earlier, preventing any push up above Friday’s high. Selling coming in below Friday’s high would indicate a lower intraday high an an opportunity to catch a potential down move early. Pushing through 1960 and grinding up would obviously negate the negatives for the market.
If we do start selling down early next week, I would expect some initial support to come in around 1930 to 1925. A break of this later in the week could see the market return to the 1905-1910 level.
Free Webinar
We will be doing a free webinar to preview Chart Reading Mastery and some of the principles taught in the course as seen in current markets. If you have been waiting for Chart Reading Mastery (it’s been over two years since I last taught this highly acclaimed course) or you just want to see Wyckoff principles in current markets, you can register here: Free Webinar: Chart Reading Mastery Returns

Leave a Reply