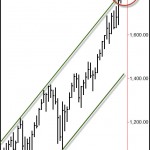
 We’ve been discussing the likelihood of a significant pullback in Deep Practice for the past several weeks. The monthly chart of the S&P cash market shows an overbought position in the trend channel. Because it is occurring on the monthly chart, the odds of a significant move becomes more likely. The market sell-off that began last Thursday is the beginning of the monthly correction. Of course, the market may trade within a range up here, going sideways for a while, or trend lower. We will have to see how the data unfolds in the coming weeks.
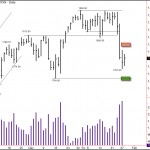
The Thursday-Friday-Monday sell-off did do damage to the market, at least for the near term. Volume has picked up, indicating supply is definitely present. Buyers have not shown themselves to be very aggressive yet, although the market stopped falling yesterday on high volume, so there is an attempt to halt the down move. It is clear that the market is oversold near-term.
 Any rally up is likely to find trouble overhead. That’s because of the heavy selling we have seen. Buyers would have to be willing to undertake significant buying to overcome that overhead selling, and typically that has lower odds of happening right off. We will generally see more backing and filling until selling has been taken out of the market before the market can rally much after a move like we have just experienced. Plus, the higher time frames indicate a larger pullback is likely.
For today, watch for evidence of selling to re-emerge around the 1800 to 1805 level, if the buyers take it up to that level. The first level of resistance comes at 1792–yesterday’s highs. Any further downside below yesterday’s low (1767) is likely to have difficulty around 1754.

Leave a Reply