group-29
  • 40% Spring Sale
  • Membership Plan
  • Courses
  • Training
  • Coaching
  • Dr. Gary
  • Blog
  • Book
  • Press
  • Login
  • 0 items
  • 40% Spring Sale
  • Membership Plan
  • Courses
  • Training
  • Coaching
  • Dr. Gary
  • Blog
  • Book
  • Press
  • Login
  • 0 items
  • 40% Spring Sale
  • Membership Plan
  • Courses
  • Training
  • Coaching
  • Dr. Gary
  • Blog
  • Book
  • Press
  • My account
  • Login
  • 0 items
×
  • 40% Spring Sale
  • Membership Plan
  • Courses
  • Training
  • Coaching
  • Dr. Gary
  • Blog
  • Book
  • Press
  • My account
  • Login
  • 0 items
You are here: Home / Uncategorized / The Week Ahead – A Wyckoff Perspective

The Week Ahead – A Wyckoff Perspective

December 11, 2011 by DrGary Leave a Comment

Last week produced a fairly narrow range of trading.  The first three days of the week saw low volatility, while Thursday and Friday saw activity pick up.  Despite the end of the  week jump in trading activity, only the Dow pushed above last week’s highs.

Comparative Strength & Weakness: Current Market
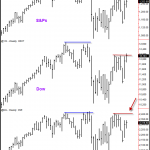
Naz is lagging

The chart for this post is a weekly chart of the S&Ps, Dow, and Nasdaq futures markets.   In applying the Wyckoff Method, we pay attention to the comparative strength and weakness of related markets.

Here, you can see that the Dow managed only a slight new high last week.  After six straight days of trading, the S&Ps made no net progress (see daily chart, not shown).  It’s the same for the Nasdaq.  This can mean that demand has tired, or, alternatively as there is a supply area to the left in both of these markets, it could mean that the markets are attempting to absorb that supply in anticipation of higher prices in the near future.  At this stage, it is difficult to tell which is more likely to be occurring.

One clue may be found in the comparative strength or weakness among the three markets.  Compared to the Dow, both the ES and especially the NQ closed the week some distance away from recent highs.  You can also see that the Naz had been stronger going into the end of October, but has since become weaker.

A Recent Example

We had a similar situation as this develop last July (highlighted by the blue horizontal lines).  In that case, it was the Dow that was lagging and the Naz that was attempting to pull the markets higher.  The disconnect led to a rather dramatic sell-off.

Circumstances today are unquestionably different than they were in July.  For one thing, there seems to be more anxiety about Europe lately.  For another, even though the Nasdaq was reaching for higher prices last July, it was also displaying clear shortening of the thrust after a lengthy up move.  Also, the seasonal bias in July was the opposite of what it is approaching the holidays.  Nevertheless, it is worth being aware of the present chart situation.

How to Apply this Information

Keep an eye on the Naz.  If we continue to rally and approach the 1283.50 high (basis ESH12) this week and the Naz continues to substantially lag, it can mean difficulty for the S&Ps at that level.  On the other hand, if the Naz “catches up” and becomes more in sync with the Dow, then a push to and possibly through 1283.50 is more likely.

If the current rally fails and we stall or upthrust the most recent 1266 high or fall below last week’s lows, it will be the Naz that leads us down.

Volatility & the FOMC

Keep in mind that we have the FOMC meeting announcement on Tuesday afternoon.  Given the narrowness of last week’s range, we would be anticipating an increase in volatility this week and the Fed announcement may be the trigger.

Tweet
Share
Pin
Share
0 Shares

Filed Under: Uncategorized

custom message for non-logged in members here

Leave a Reply Cancel reply

Your email address will not be published. Required fields are marked *

Privacy, Disclaimer & Policies

Peak Psychology Inc and its website, TradingPsychologyEdge.com is an educational company. It has been providing customers from around the world training classes and products on trader mental skills, trader performance, and technical chart reading.

Trading Stocks, Futures, Options on Futures, and retail off-exchange foreign currency transactions involves substantial risk of loss and is not suitable for all traders and investors. Past Performance is not indicative of future results.

The testimonials are from selected customers. Their experiences may not be typical of what you can expect to achieve, As results may vary. Claims contained within testimonials have not been verified. Customers were not paid or compensated in any way for their statements.

dmca

Recent Posts

  • Dr. Gary’s Market Insight June 17-21 2024
  • TradeMindfully.com Offers Classes on David Weis’s Trades About to Happen
  • Join Dr. Gary’s Free Webinar on How to Develop Yourself as a Mastery Trader
  • Let TradeMindfully Be Your Support System
  • Dr. Gary’s New Website Is Live

Search

  • Facebook
  • Instagram
  • Pinterest
  • Twitter
  • YouTube
Back to the top
group-29

Sign up to get the Recorded Free Webinar, New Course Releases and more…

  • About
    • Dr. Gary
    • Book
    • Press
  • Courses
    • Chart Reading
    • Trade Setup & Indicators
    • Trading Psychology
    • Specialty
    • Trading Procedure & Technique
  • Offerings
    • Coaching
    • Membership
    • Training
  • Help
    • Dr.Gary’s Blog
    • FAQ
    • Free Content Library
    • Contact Us
𝕏

Coppyright © 2023 Peak Psychology Inc. All Right Reserved | Term of Service | Privacy-Policy

Any and all information contained on this website is provided for educational purposes only and should not in any way to be construed as investment advice.

×