Free Webinar Info Used to Earn 16 Points!
The Free Webinar we held yesterday had much useful information about trading by price and volume, including tick vs time charts. Fifteen different trade setups across five different markets were detailed in this 50-minute presentation. This morning, one trader wrote to say,
I can’t believe how good the content is. The info regarding tick vs time charts was pure gold. I took a trade in the ES this morning based off what you taught yesterday and made 16 points profit! Wow!
For those of you who registered and missed yesterday’s presentation, you can still access it at the link provided. For those of you who didn’t register … well, OK, you can still sign-up and get the content. Here is the link: Free Webinar Wyckoff Principles
Tick vs Time Charts
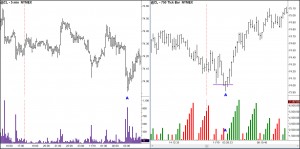
Several traders asked about why I use tick vs time charts in my intraday trading. Pros understand the value of tick vs time charts; most novice traders don’t. Tick charts build bars based off the number of trades that take place (called ticks). You set the amount of trades or ticks for the bar (for example, 3000 ticks in the ES). One thing this does is make the overnight data much more readable, especially when combined with the Weis Wave for volume. The chart shows an example.
 Here we see a standard, 5-minute bar chart of Crude oil and alongside this, a 750 tick chart. The vertical red dashed line on both charts represents the beginning of the trading session. Note the 5-minute chart is drawn out with small price bars, lots of gaps and numerous spikes. It’s difficult to read. The tick chart, on the other hand, compresses the same data into a readable form. At A, the 5-minute chart looks threatening. We see large bars down and heavy volume. It’s hard to justify a long trade here, but that is what was called for. The tick chart shows this as a non-threatening pullback and, indeed, a nice Wyckoff Spring. Note the volume and compare with the 5-minute chart. See the difference between tick vs time charts? It should be jumping out at you.
Major Sale & 30% Discount
In honor of Black Friday and to celebrate our new website, we have put all of our video tutorial on sale. You can enjoy a 30% saving off the listed price by using the coupon NewWebsite30 at checkout. The 30% discount may be applied to both trading courses and trading psychology courses.

Gary Dayton is great! You can read this article in Russian language at http://www.sprosipredlozhenie.com