A Trader’s Question
Kate, a trader, asks a really good question regrading the last blog post (see that post and Kate’s question here).
She noted that I was looking to sell yesterday around the 2010 level, but since the market moved higher, would that need a re-assessment? Let’s take a look at how to treat areas like this.
Identifying a Key Level
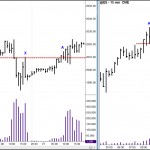
 The 2010 level was the two-day low. On the hourly chart, you can see that price formed the 2-day low late in the day (just above the 2010 label). The next day (labeled as X on the hourly chart), the market rejected higher prices above 2010. That was decent resistance forming and I noted in Tuesday’s post that “I’ll be looking for a short opportunity on any weakness around or just above the 2010 level.”
Market Approaches the 2010 Level
When the market re-approached the 2010 level (see A on both the 60- and 15-minute charts), we indeed did see the resistance trying to hold. It didn’t last long, however. I’ll go through the details below. Note how much trading occurred around 2010. As anticipated, it was a significant level for the market as we see two hours of trading back and forth where sellers attempted to hold it and buyers had the intent of pushing through it.
While we can often identify and anticipate significant market levels as a function of market structure, we can never know in advance whether they will hold or break. For that, we have to see how the market trades around them on the intraday time frames.
Details of Buying and Selling on the Lower Time Frame
On the 15-minute chart, we see pre-US open that the market had approached the level at A, and although there was some weakness on the hourly, we were in an uptrend on the 15-minute. Typically, markets don’t hit a level and immediately reverse. We expect some back and forth. As the US session opened, we see the first 15-minute bar (1) show some buying strength at the 2010 level. The strength of the bar and the volume were enough to cancel ideas of shorting. The next bar (labeled with a B) also shows buying coming into the market. Selling comes in at 2, but we are now 8 points above the 2010 level – buyers were exerting bullish pressure.
For the next 90 minutes, we trade around the 2010 level, highlighting it’s significance. I labeled bars as either B or S for buying or selling. Bar 3 was down and certainly had selling on it, but the close was back above the low of Bar 1, indicating buyers were strong in this area (if the sellers were really strong, they would have closed it near, if not under the low of 1). Bar 4 shows a pick-up in volume and no ability on the part of the sellers to continue to push the market down (compare price action and volume of Bar 4 with the preceding bar–selling was being absorbed buy buyers). Bar 5 confirmed the buying on Bar 4.
When I look at a level like 2010, I am thinking of it in terms of a day trade. While I still think the overall market will head lower in the near future (based on the weekly chart), that will likely take days if not a week or more to unfold, if it does.
Free Webinar Recording Available
We had a webinar covering daily bar-by-bar reading of GOOG, how to use the comparative strength and weakness of related markets (daily charts), and the use of the 3-10 oscillator and Weis Wave on intraday charts. I covered a lot of material. It’s been recorded and you can access it at the link below:

Leave a Reply