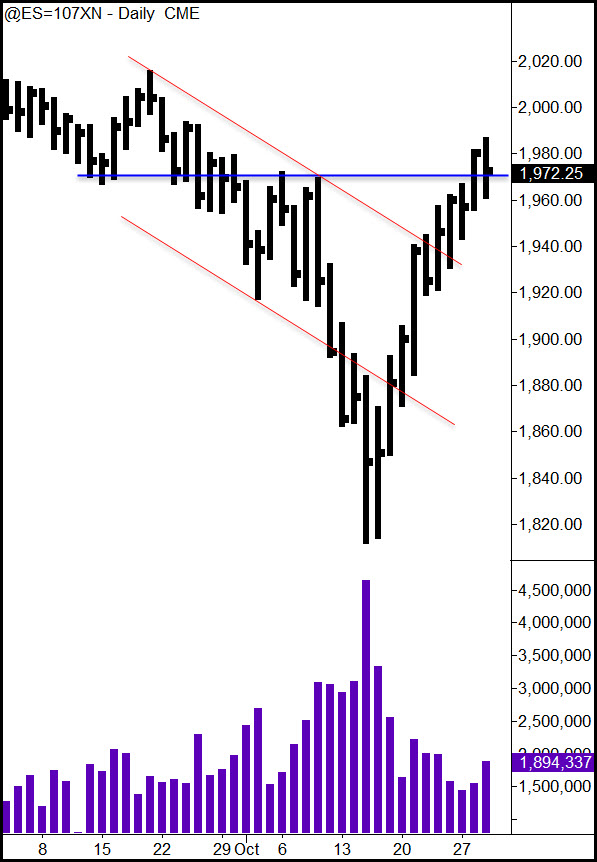
 In the last post made on the US Stock Market on Sunday night, I noted that the S&Ps was moving up strongly, but had run into a resistance area around the 1970 level. A pullback into the 1940 level was anticipated (we went to 1944.50), and then the market rebounded, making a new rally high today. Despite the new rally high, we are still negotiating that 1970 area. Today’s market action was influenced by the FOMC announcement that their QE is coming to an end. The day closed below yesterday’s high and in the middle of its range.
The market responded rather well to what could be considered negative news. After all, the tone of the announcement is that the Fed will be turning off the tap to easy money. The market seemed to shrug that off. Does this response to the news mean the market is going to go higher? Or, perhaps the market will wake up to this policy change and fall hard tomorrow? As we discussed recently in Chart Reading Mastery, it’s best not to try to figure out how the market will react to news. Instead, it is best to read the chart!
I’ve posted a 45,000 tick chart showing the rally from the lows made on October 15th. The market rallied up nicely in a well-behaved manner 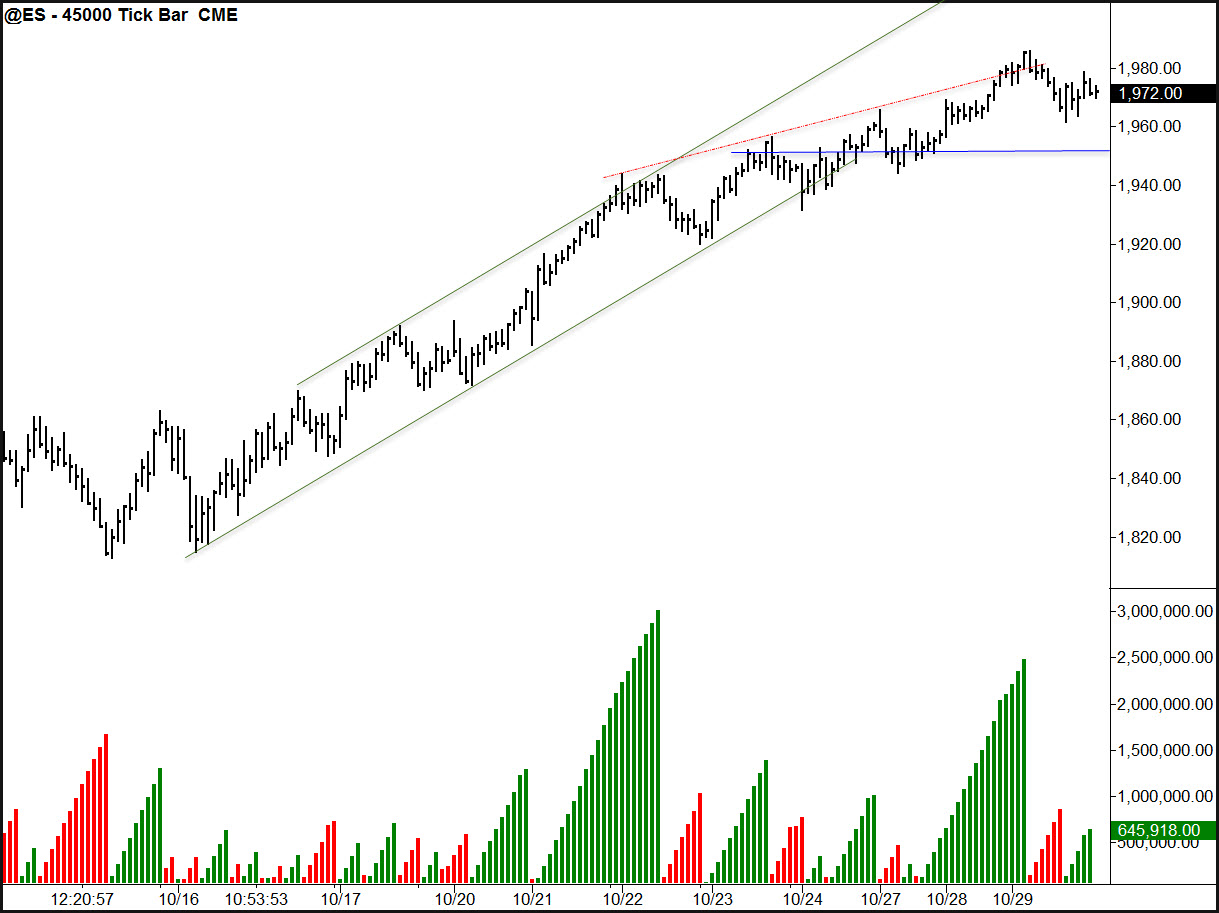 until last Thursday, October 23rd (right click to expand and/or open the chart in a new tab or window). On Thursday, we began to see shortening of the thrust. And while we have continued to make higher highs since, the thrust continues to shorten. No supply has shown its hand to this point–though there was a fair amount of effort to go up yesterday with something less than a commensurate response in price, so some selling can be seen, but we have not seen supply dominating demand. So, what does all this mean?
The market seems vulnerable to a pullback. We could see the market fail to go higher and begin dipping lower here. If it does go below today’s low (1962.00) and we don’t see significant volume come in to the downside, a reaction would likely end around 1955 to 1950. A stronger reaction could move the market down into the 1945-40 area where we could expect buyers to come in. A spring of yesterday’s low or holding higher above yesterday’s low would indicate that the market is not ready to react and we could anticipate potentially higher prices if a rally gets going.

Leave a Reply