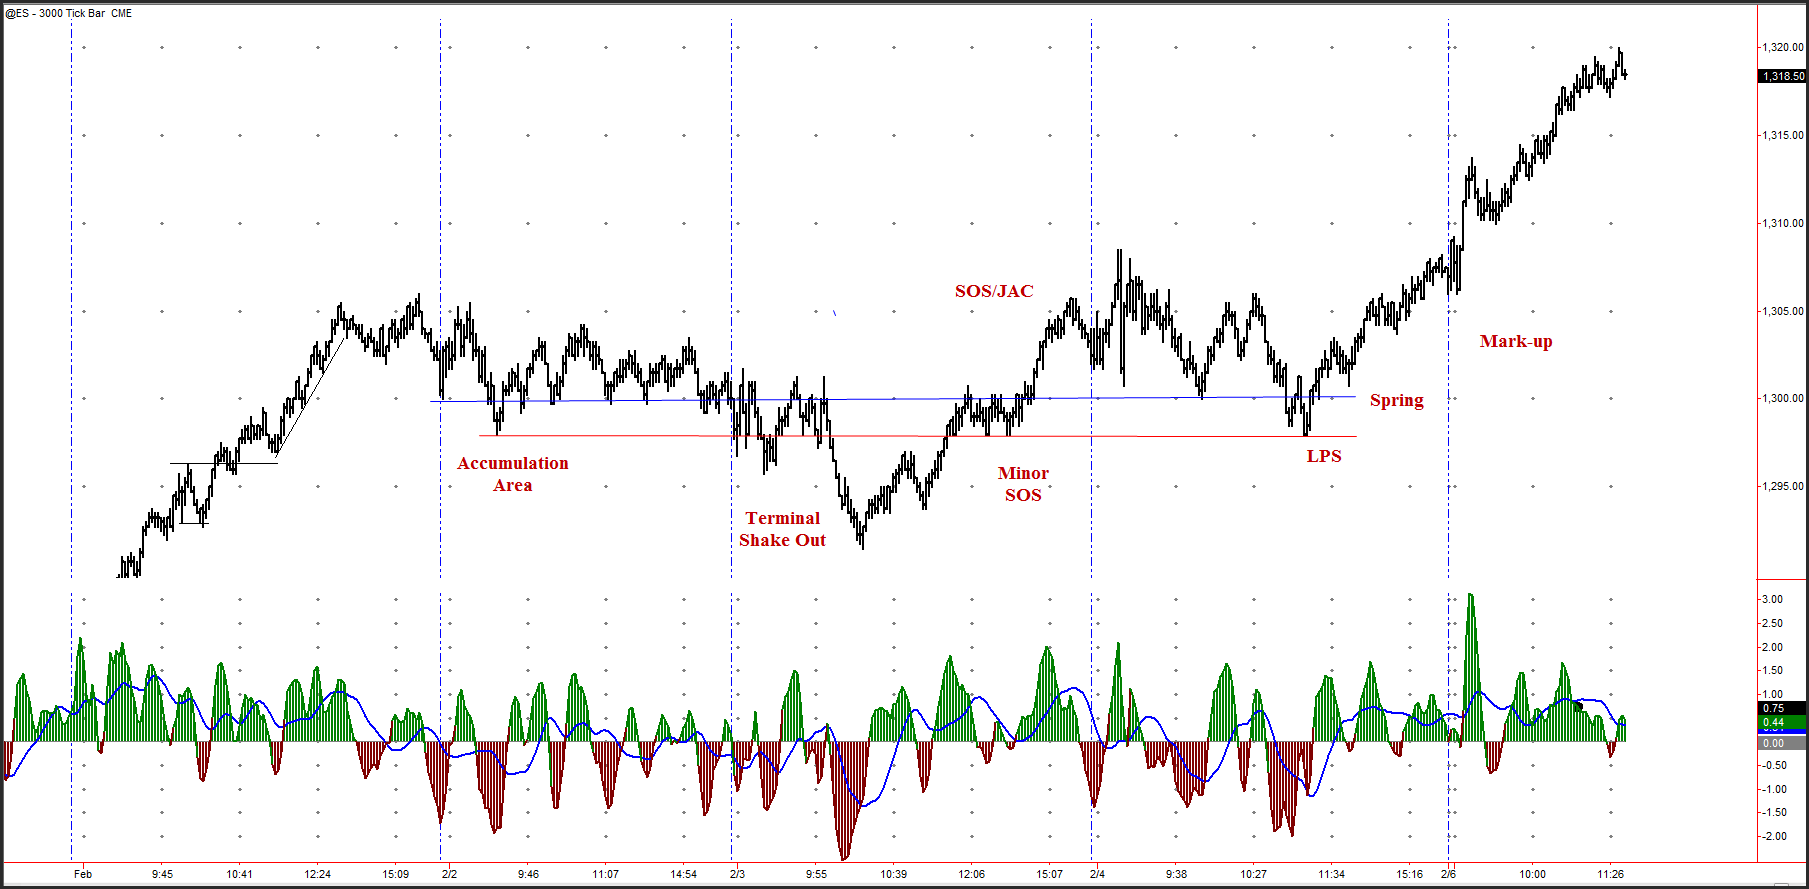
Wyckoff certainly stands the test of time across all time frames. Here is an intraday chart that shows the following:
- Accumulation, or technically, re-accumulation, since we remain in a strong uptrend
- A terminal shake-out at the end of the accumulation phase
- A minor sign of strength as the market jumps across the minor creek
- Major sign of strength as the market jumps the creek
- A back-up to the edge of the creek
- The last point of support
- A spring
- And, the mark-up phase indicated by all of the above.
Click on the chart image to bring up a larger chart.
Although Wyckoff wrote about these principles using daily charts, all of the principles occur on a 3,000 tick chart over the past week of trading.
On Thursday, we will begin Deep Practice on reading the markets the Wyckoff Way. I’ll be incorporating both Wyckoff prinicples and elements of the psychological science of deliberate practice to help you learn to read the market quickly and effectively. You can learn the details at the link below:
I look forward to seeing you Thursday!
Trade Mindfully,
Dr. Gary


Gary,
I took your chart reading course, so maybe I should know this, but in your chart of the re-accumulation you are using a tick chart, as I’m sure you know. I understand how the market structures such as a spring can be seen in any chart, but isn’t volume needed to make the determinations of the actions of accumulation or distribution? In other words, don’t we need a time based chart along with volume to see how the process unfolds or am I missing something. I guess another way of asking this is how do you know its accumulation when using a tick chart? Is it seen in the oscillator?
David
Hi David,
Very good question. I use Tick charts to compress the overnight data on the ES and other 24-hour markets into a readable form. Because of its construction, I find that volume on Tick charts is less useful than time-based bar charts and usually do not look at the volume.
Volume certainly is helpful in reading accumulation and distribution. A momentum oscillator is not of much help; I use it for other things. Market structure is always the priority element in reading a chart. The market structure of this chart was trending up. As the market reacted, it held its gains well. The basic elements of Shake Out, SOS, JAC, LPS, etc occur in sequence and can be both seen and anticipated without volume. That being said, volume remains a key ingredient. However, if you tried to read this period with a 5-minute chart you would be hard-pressed to see through the distortion. There are always tradeoffs to make.
Gary