group-29
  • 40% Spring Sale
  • Membership Plan
  • Courses
  • Training
  • Coaching
  • Dr. Gary
  • Blog
  • Book
  • Press
  • Login
  • 0 items
  • 40% Spring Sale
  • Membership Plan
  • Courses
  • Training
  • Coaching
  • Dr. Gary
  • Blog
  • Book
  • Press
  • Login
  • 0 items
  • 40% Spring Sale
  • Membership Plan
  • Courses
  • Training
  • Coaching
  • Dr. Gary
  • Blog
  • Book
  • Press
  • My account
  • Login
  • 0 items
×
  • 40% Spring Sale
  • Membership Plan
  • Courses
  • Training
  • Coaching
  • Dr. Gary
  • Blog
  • Book
  • Press
  • My account
  • Login
  • 0 items
You are here: Home / Wyckoff Trading / Point & Figure Charting in Crude Oil

Point & Figure Charting in Crude Oil

November 2, 2015 by DrGary 2 Comments

Point & Figure charts are highly useful to traders.  Point & Figure charting tells us is the strength of support and resistance and also the potential extent of a move – highly valuable information.

Point & Figure Resistance in Crude Oil

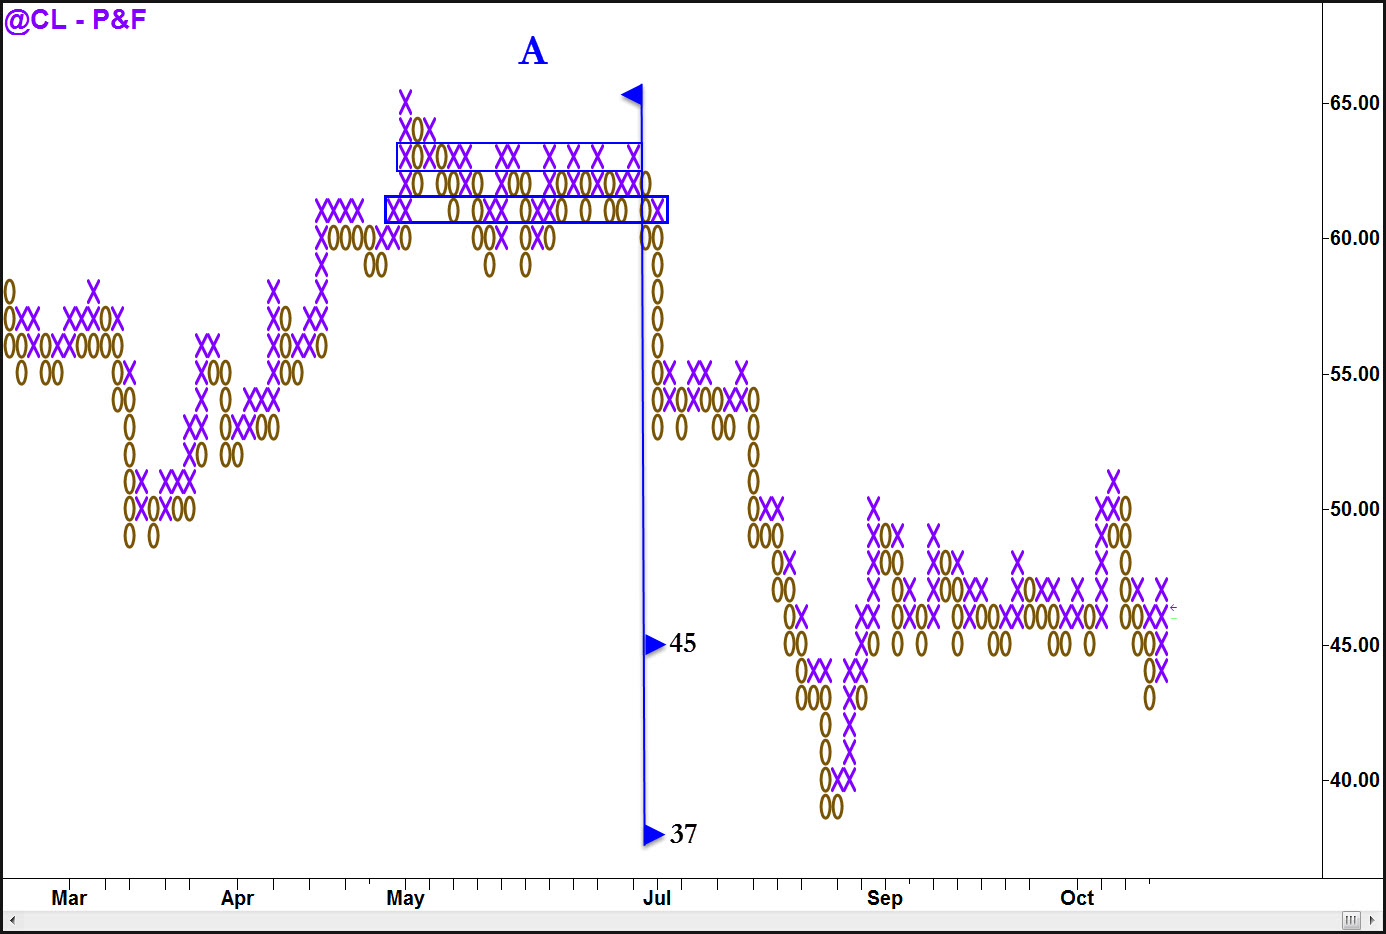
The spring rally in Crude Oil died out by May. The market went sideways for two months during May and June, showing significant market resistance had set in. Telltale Wyckoff indications told traders that selling had become strong and was preventing buyers from taking prices higher. One of the great benefits of Point & Figure charts is that significant resistance shows itself clearly by the horizontal movement in the area labeled A, further confirming the market’s weakness.

Point & Figure Charting
Accurate P&F Target Projection

Traders can use this valuable information to their advantage. By taking a count of the resistance and projecting it, potential targets for the coming move can be calculated.

Point & Figure Targets

In this chart, two counts were taken. The first is the more conservative count, which is always applied as an initial target projection. In this case, the conservative projection indicated a reaction to 45. Because the market decline showed no ability to rally around the 45 level, a second count incorporating more of the distribution range projected a reaction down to 37. The market came to a stop at 38.

Notably, these projections were known ahead of time. Although we didn’t know for certain that the market would fall substantially lower, both counts indicated the potential for a large, worthwhile move. It’s our job as traders to monitor and manage our trades. As long as we see no contravening market action, we can assume the market will continue to head towards our projected counts. This is a strong advantage when managing a trade.

More Point & Figure Charting

Next Tuesday, November 10, we will be holding an in-depth webinar on the Wyckoff Method of Point & Figure charting. There is a 50% discount offered for those who register by November 10. After that date, the discount will no longer be available. You can learn more about the webinar and how to register at this link:

Point & Figure Charting to Maximize Your Profits

Tweet
Share
Pin
Share323
323 Shares

Filed Under: Wyckoff Trading Tagged With: point & figure chart, wyckoff trading

custom message for non-logged in members here

Comments

  1. Jeff Tindle says

    June 14, 2021 at 5:27 AM

    What box size and reversal do you use for CL( crude oil)?

    I can’t get any size to accurately measure the move.

    Thanks

    Reply
    • DrGary says

      June 14, 2021 at 4:29 PM

      I think that is a one point and a one box reversal, so 1 x 1 point & figure. You may not be using a low enough time frame to calculate the p & f. I’d use an hourly time frame with settings that account for the full range of the bar – high and low, not just close.

      Reply

Leave a Reply Cancel reply

Your email address will not be published. Required fields are marked *

Privacy, Disclaimer & Policies

Peak Psychology Inc and its website, TradingPsychologyEdge.com is an educational company. It has been providing customers from around the world training classes and products on trader mental skills, trader performance, and technical chart reading.

Trading Stocks, Futures, Options on Futures, and retail off-exchange foreign currency transactions involves substantial risk of loss and is not suitable for all traders and investors. Past Performance is not indicative of future results.

The testimonials are from selected customers. Their experiences may not be typical of what you can expect to achieve, As results may vary. Claims contained within testimonials have not been verified. Customers were not paid or compensated in any way for their statements.

dmca

Recent Posts

  • Dr. Gary’s Market Insight June 17-21 2024
  • TradeMindfully.com Offers Classes on David Weis’s Trades About to Happen
  • Join Dr. Gary’s Free Webinar on How to Develop Yourself as a Mastery Trader
  • Let TradeMindfully Be Your Support System
  • Dr. Gary’s New Website Is Live

Search

  • Facebook
  • Instagram
  • Pinterest
  • Twitter
  • YouTube
Back to the top
group-29

Sign up to get the Recorded Free Webinar, New Course Releases and more…

  • About
    • Dr. Gary
    • Book
    • Press
  • Courses
    • Chart Reading
    • Trade Setup & Indicators
    • Trading Psychology
    • Specialty
    • Trading Procedure & Technique
  • Offerings
    • Coaching
    • Membership
    • Training
  • Help
    • Dr.Gary’s Blog
    • FAQ
    • Free Content Library
    • Contact Us
𝕏

Coppyright © 2023 Peak Psychology Inc. All Right Reserved | Term of Service | Privacy-Policy

Any and all information contained on this website is provided for educational purposes only and should not in any way to be construed as investment advice.

×