Craig, a trader using Wyckoff and VSA principles, commented on the UpThrust trade setup. You can see his comment here, on the VSA Trading Group FaceBook page. (Thats a cool group you might want to join, BTW).
Springs & UpThrusts

Springs and UTs are my ‘bread & butter’ trade setups. They are so valuable to a trader because they 1) have very high odds in the right market conditions, 2) occur frequently, 3) provide low risk entries, 4) tell you immediately when they aren’t working, 4) often take off like a rocket, and 5) help define market structure. What other trade setup does so much?
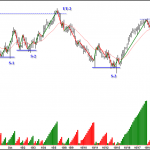
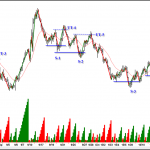
There are two recent charts in this post. One is of the S&P e-mini, the other is the Aussie $. Both are higher time frame intraday tick charts – more or less equivalent to an hourly chart. Tick charts are not time based, but defined by the number of trades per bar. This allows me to compress the 24-hour markets into a continuously readable format.

You can see on both charts that the Spring & UT trade setups caught most of the market turns. You can also see how frequently they occur and how quickly they can move price in the trader’s direction. Note that this is about an hourly chart. There would be many more Springs and UTs on lower time frame charts during this same period.
One Spring on the Aussie $ did not work. This is marked by a red X. Traders who understand market structure would know that this was not a choice setup and would have avoided making a trade there. There was also a Spring on the S&Ps (not marked, but just under UT-4) that also failed. Do you know why these two were poor trade choices? Post your answer in the comments section.
Spring & UT Tutorials
If you are interested in trading these valuable setups and want to learn more about them, you can check out the video tutorials I did on these two setups. Each is over 120-minutes long. They cover the two trades in great depth. As David Weis frequently says, “You can make a living trading nothing but Springs and UpThrusts.” Find out what he means at the links below.

Gary, I’m not familiar with interpreting Weis wave or details about Springs yet. Still, there are a couple of things I notice about the failed spring S-X. One is that the Weis wave indicator is red and much higher on that one bar that drops below support than on the successful springs. That would indicate there is still a lot of supply at that point. Also, I don’t know if it’s significant but it also looks like none of the bars in the failed spring area actually close below the support level which I think would reinforce the idea that there is still too much down volume, or supply. What is the answer?
There is a lot of supply indicated by WW, but I think even more important is that in both failed springs the structure is indicating weakness. In one of the charts price just broke out of a trading range, or fell through ice. That is strong weakness in its own right and one should look to short. On the other chart not only is there supply there is no indication of demand and weakness in the background.
David
At S-X price has made a lower low after a break down below the horizontal distribution range support line and results in a larger down wave. This is a sign of weakness. Price tested prior support, found new resistance and reacted. There is also no prior strength in the story when the spring occurs at S-X. Along with SOW in WS, the Wwave is warning supply has overcome demand too.
At S-X price has made a lower low after a break down below the horizontal distribution range support line and results in a larger down wave. This is a sign of weakness. Price tested prior support, found new resistance and reacted. There is also no prior strength in the story when the spring occurs at S-X. Along with SOW in WS, the Wwave is warning supply has overcome demand too.
Not entirely sure about the UT-4 spring bar and setup that applies (springing off prior low at S-3?) and how structure relates. Like to know your comments however, Gary.
Dean.
A nice job analyzing this spring by Craig, David & Dean. Here are my comments:
Craig – Your observations are very good ones. The Weis Wave is picking up that supply is dominant in this area. The response to the spring was also very weak, as I think you are trying to point out. Comapre the response here with the other springs. A spring should move away from the danger point (the lows) very quickly. When it doesn’t like here, the spring is in trouble.
David – You are absolutely right. Structure is very poor for a spring here. We have just broken down from a trading range. That is a clear indication to go short, as you say. The UT (UT-2) was the trade to take here.
Dean – you picked up on the breakdown, as well. You also note that the Weis Wave is showing us larger down waves with not strength in the up waves – nice observation, and an important one. It says selling is in control. When we see this, it’s best to avoid springs unless we have a clear sign of strength in the near background, which we don’t here.
The spring just below UT-4 rallied a few points and was OK for a day trade because it came off larger support, but you can see that supply was dominate from the large down wave and its associated volume that preceded it. UT-4 was the trade in this area due to the weak market structure and conditions.
Gary
Gary,
Would you comment on spring S4 on the ES chart. I’m guessing it’s an Effort vs Result situation, however, are there any other indications that would support a long trade? It seems as though everything points to weakness except for the E vs R in the WW. Is that sufficient? I’m thinking you would say it is, but I’d be sweating bullets at a long trade. Who said….”the best trades are the hardest to take…” That is one of them.
David