Using the 3-10 Oscillator
Using the 3-10 oscillator is often helpful in following price action. We aren’t particularly big on indicators, but the 3-10 is one that can highlight important market information that would ordinarily go unnoticed. Friday morning in the S&Ps provides an excellent example.
Using the 3-10 Oscillator: S&P e-mini
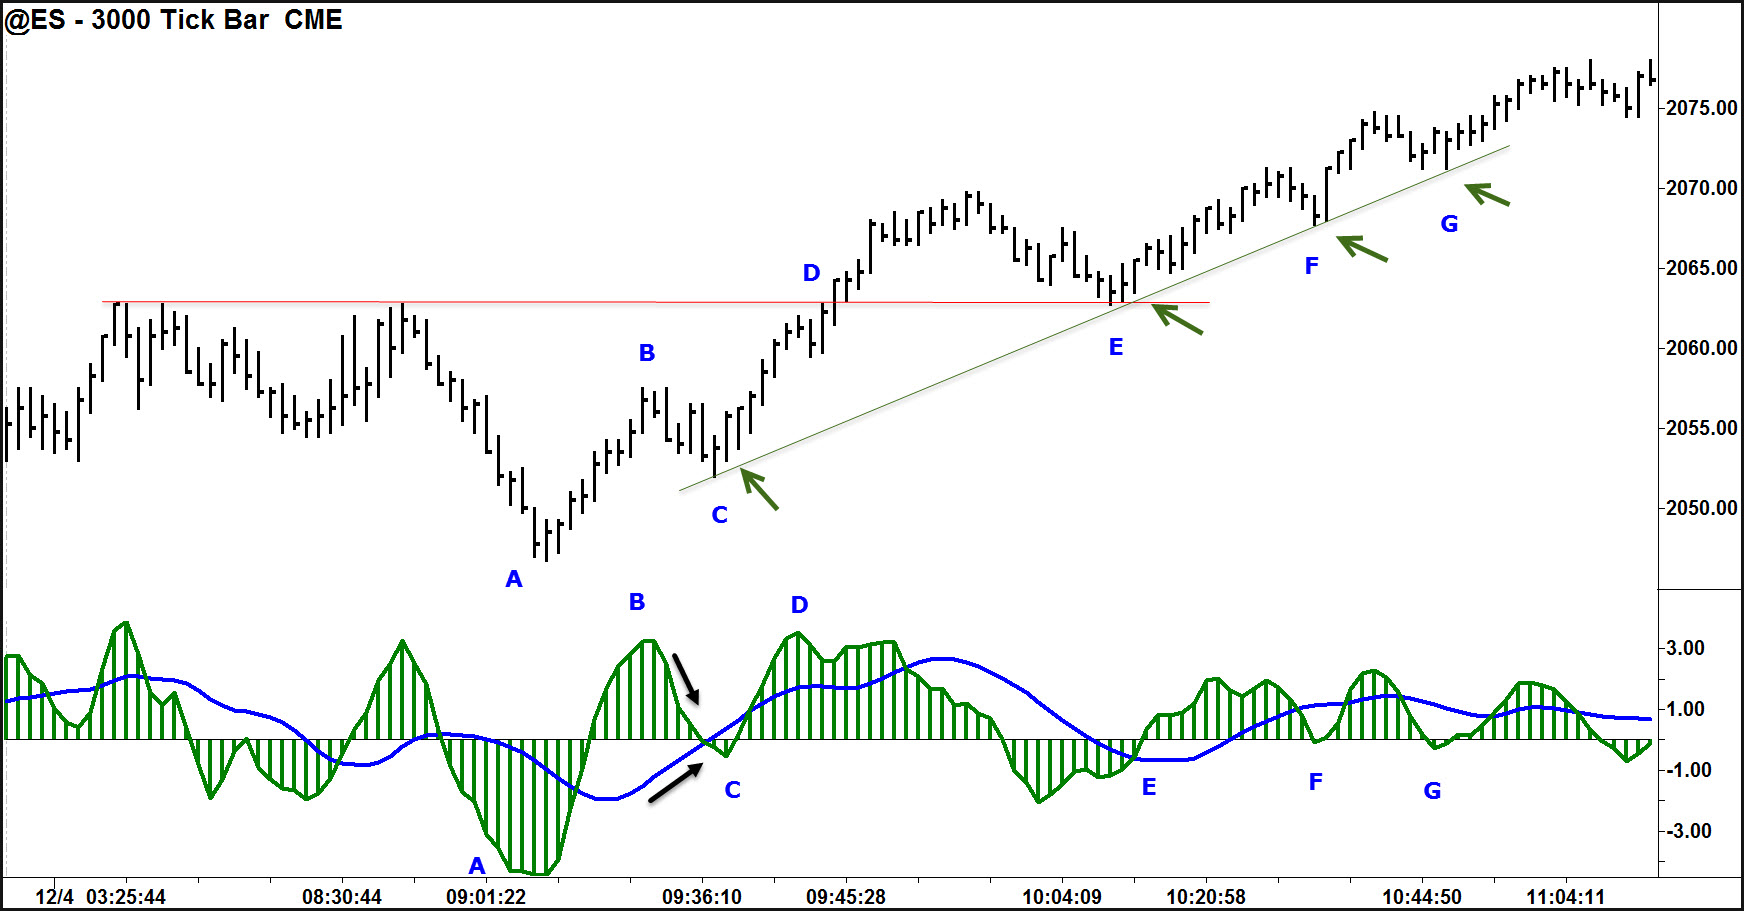 Thursday’s trading resulted in a trend day down. On the day after a trend day, we would typically look for back and forth trading. Both the Asian and European sessions traded the S&Ps well off Thursday’s lows. Just prior to the US session open, the market started falling (A). I thought at first, the market would revisit Thursday’s low.
That didn’t happen. Instead the market rallied to B. This was a decent rally, but looking at the price action alone, it was hard to tell that demand was coming strongly into the market. The 3-10 Oscillator, however, let us know buyers were taking control.
The 3-10 had a strong move up, reflecting good momentum to B. More importantly, the blue trend line began a steady drive up. As the 3-10 line (green) pulled back and corrected, the blue line did not weaken. In fact, it showed strength as it crossed above the zero line. The correcting 3-10 with a rising trend line set up a great trade at C hidden to most traders.
Because the 3-10 oscillator tracks momentum so well, we could also tell that the overnight high at D was likely to be broken by the strength of the oscillator – again, not easily seen by price action alone. The 3-10 oscillator helped you hold the trade.
Using the 3-10 Oscillator: Sometimes It Isn’t Helpful
A nice trade set up at E, but frankly, the 3-10 wasn’t especially helpful here. Although you can trade well off the 3-10, it doesn’t highlight every trade (and, no, we don’t think using it for minor divergence is a productive way to trade it). New trades at F and G were signaled by the 3-10 oscillator on the minor pullbacks as the market pushed its way to new highs on the day going into the noon hour.
The proper indicator can be useful in identifying trades. You don’t need lots of chart jewelry. The 3-10 is simple and effective when the trader understands how to use it. We have a comprehensive tutorial on the 3-10 oscillator that you can learn more about at the link below, if you are interested.

I differ with you assessment that the 3/10 was not helpful at point E. Note how the slow line was falling (still above zero line). This often indicates the possibility of a deeper pullback, OR hints that a complex retracement (ie an ABC) may be setting up. This was just such a case at E. An ABC correction at a support (or resistance if selling) is a highly desirable setup. (You can verify this with LBR). :o) The fact that the ABC gave us a “with trend” divergence made this an even stronger long setup.
Thus, I would offer that the 3/10 gave us insights as to what might be setting up (a complex pullback), and when doing so with divergence and at support, well, need I say more.
Nice article, and great information as to the value that this simple tool can provide to all of us that trade! Thanks.
Kirk,
Thanks for posting. I appreciate your comments.
Generally, I refrain from using–and especially teaching–divergences on the 3-10, even when consistent with the overall trend. I agree with you that a nice A-B-C set up and this was a good trade, but I would encourage traders to see the setup as a corrective A-B-C on top of support after new momentum highs, and not because divergence occurred in the 3-10.
I have found that traders tend to ‘lock into’ divergences and ignore the other information on the chart. Divergences are salient (i.e., easy to see) and seem to produce results, until you start trading them ;). Our minds tend to go to what is easiest to see and then stop thinking. It’s how many, many trading errors are made. Divergences are one of those things that can cause our minds to do that.
If you are really skilled in the 3-10, then seeing a divergence like this can be traded. But the operative words are “really skilled.” Many are not.
Dr Gary:
I believe you may have overstated the role of divergence here. I stated that an ABC (complex correction) at support (or resistance) is a highly desirable setup. This was the impetus for taking the trade, not divergence. The fact that divergence was present with the ABC is simply icing on the cake. I’m sorry that you (and any others) may have missed this distinction. I thought this was stated clearly, but, seemingly not. We’ll consider it clearly noted now. :o) Thanks
Kirk,
I didn’t overstate the role of divergence. You said the “divergence made this an even stronger long setup.” That is simply not true. The 3-10 added nothing to the trade at E (and a very skilled trader might, perhaps, argue that it only added a little to G, but it still could be helpful to less very skilled traders). Thinking that minor divergence made the trade strong highlights the salience issue discussed above. It is best to focus on what is on the chart and use the 3-10 to help see it better. This is best illustrated at at C and F. Try not to reverse this and see the 3-10, or any indicator for that matter, as making a trade or somehow making it stronger.
You are 100% correct. I think your article would be better served if you just delete all of my comments and we’ll leave it pristine as I found it. My apologies.
Actually, you raised a really good question that might help others reading this entry, so I’d like to keep it. Being right or not right isn’t of much value. The real value is when we learn. We are all always learning when we keep our minds open. That’s what’s most important, in my judgement.